APEX Portfolio Forecasting — Johnson & Johnson
Designed APEX, a scenario-planning platform for Johnson & Johnson's forecasting and strategy teams — replacing fragmented Excel workflows with a versioned, interactive environment for evaluating portfolio decisions across Atopic Dermatitis and beyond.
Guidehouse: AI Studio – J&J (Health Commercial) · 2026
Overview
A clear entry point for a complex system
APEX replaces Excel-based pharmaceutical forecasting with a versioned, interactive workspace : scenario planning that can be audited, compared, and defended in an executive review. Built as a one-week RFP response for J&J's commercial strategy team, covering US Atopic Dermatitis with a clear expansion roadmap.
- Pick an indication — AD, Asthma, or COPD
- Navigate to Market Map or Portfolio Forecast Builder
- Load or branch a scenario from the shared library
- Expansion markets (UK, FR, DE, ES) visible as coming soon from day one
New scenarios branch from a shared baseline. Existing ones load directly into the builder.
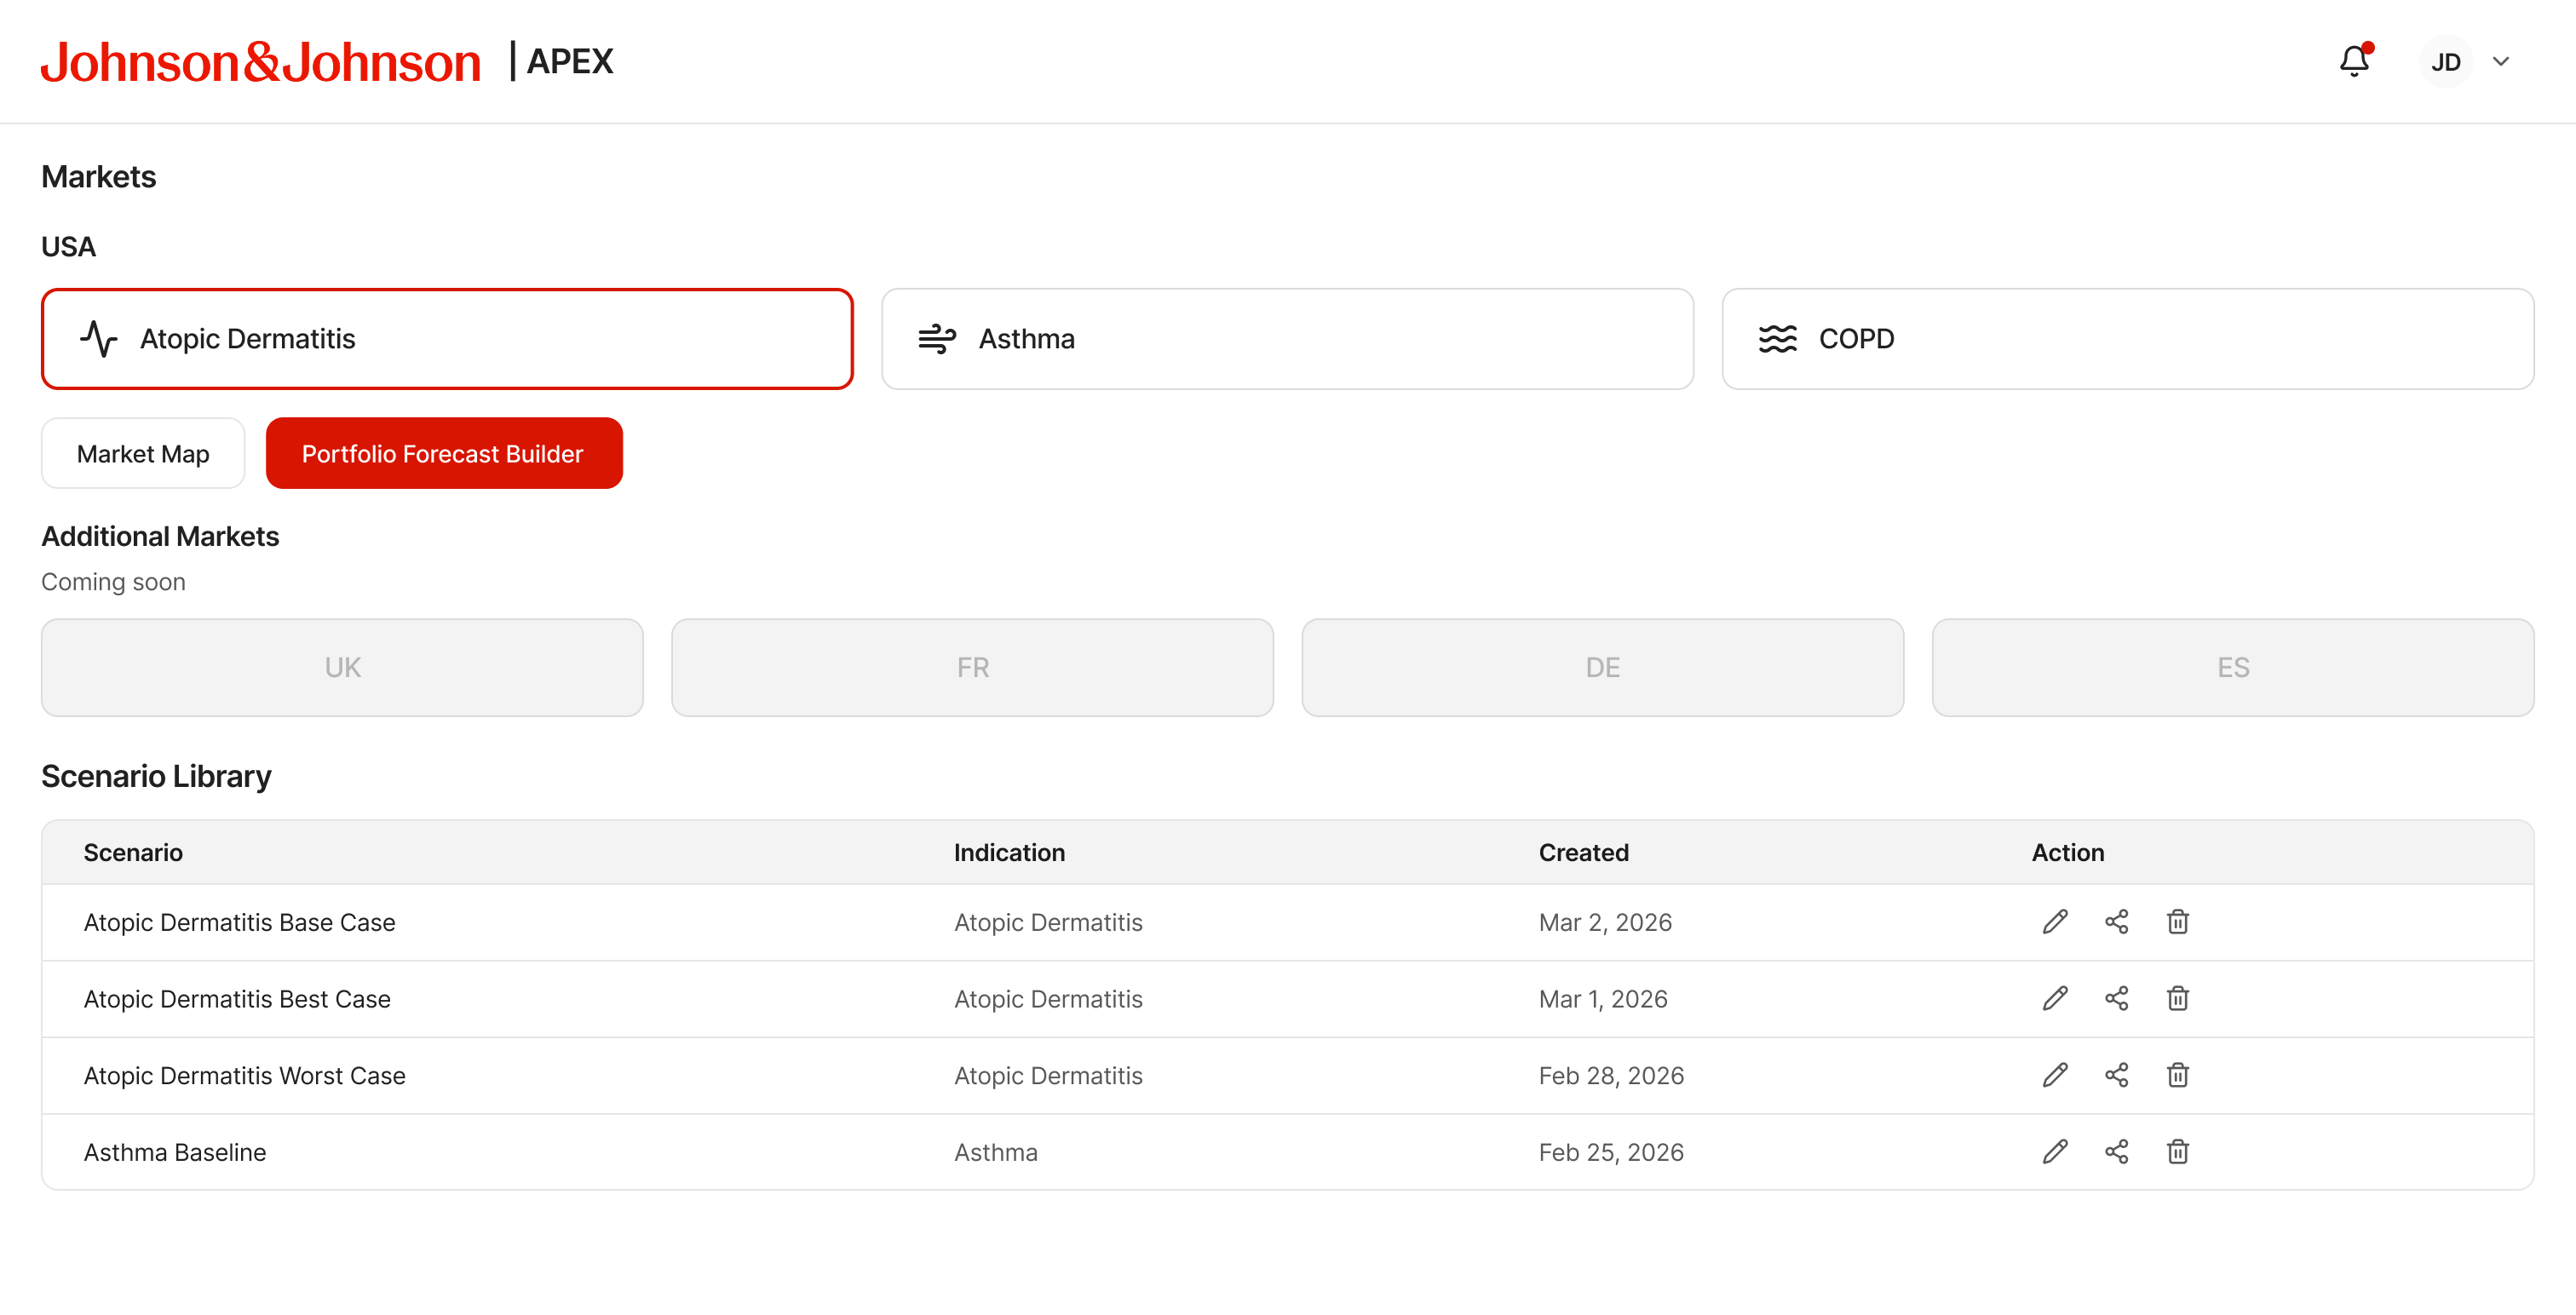
Home — indication selection, navigation, and scenario library
The Problem
Excel forecasting doesn't survive a methodology review
- Scenarios lived in separate Excel files — no single source of truth
- Assumptions duplicated across versions with no methodology tracking
- Prior outputs couldn't be reconstructed when methods changed
- No audit trail: by the time a decision reached an executive review, nobody could trace the logic behind the numbers
The RFP framed the solution: build a single versioned environment where teams can test assumptions, compare scenarios, and export results that can be defended six months later.
- Role
- Lead Designer + acting PM
- Timeline
- 1 week, RFP to pitch
- Scope
- End-to-end prototype, MVP scoping to pitch
- Team
- Health SMEs, pharma strategy leads, J&J stakeholders
- Indication
- US Atopic Dermatitis (MVP) → Respiratory (roadmap)
HowIapproachedit
This was a one-week RFP response with no dedicated PM, so I took on that role: collecting requirements, organizing the team, and running a 5-hour brainstorming session to align on direction. The team leads were new to Guidehouse and unfamiliar with its capabilities, so I helped orient the engagement while iterating on the design in parallel. Engineering hadn't started, and every decision had to be defensible enough to win the engagement and detailed enough to hand off directly to devs.
Domain grounding
- Mapped the AD market structure before designing any screens
- Covered epidemiology, competitive landscape, payer dynamics, and site of care
- Built enough domain fluency to make defensible design decisions, not just wireframes
MVP scoping
- Scoped to US Atopic Dermatitis: Market Landscape Dashboard, TPP Builder, Portfolio Forecast Builder
- Small expert user group → depth and fast feedback over broad coverage
Scenario system design
- Designed the scenario library as the central organizing structure
- Named snapshots, editable market inputs, engine selection, compare mode, export flows
- Every screen anchored to a question a strategy leader needs before an executive review
Governance layer
- Built assumption versioning, sandbox vs shared workspace, and publishing controls from the start
- Reproducibility shaped how the scenario object was structured, not added as an afterthought
APEX pitch packaging
- Renamed from FutureCast to APEX and refined the prototype for executive storytelling
- Simplified charts, added Price Optimizer, updated source-entry patterns across input forms
- Prepared design for J&J stakeholder review
Portfolio Forecast Builder
The main workspace
The builder is where forecasting happens: three-panel layout, live chart updates, no separate recalculation step.
- Left rail — market inputs, editable inline
- Main panel — forecast chart, Volume or Revenue metric
- Right panel — scenario list, Product or Market view toggle
- Including or removing a product updates the chart and scenario immediately
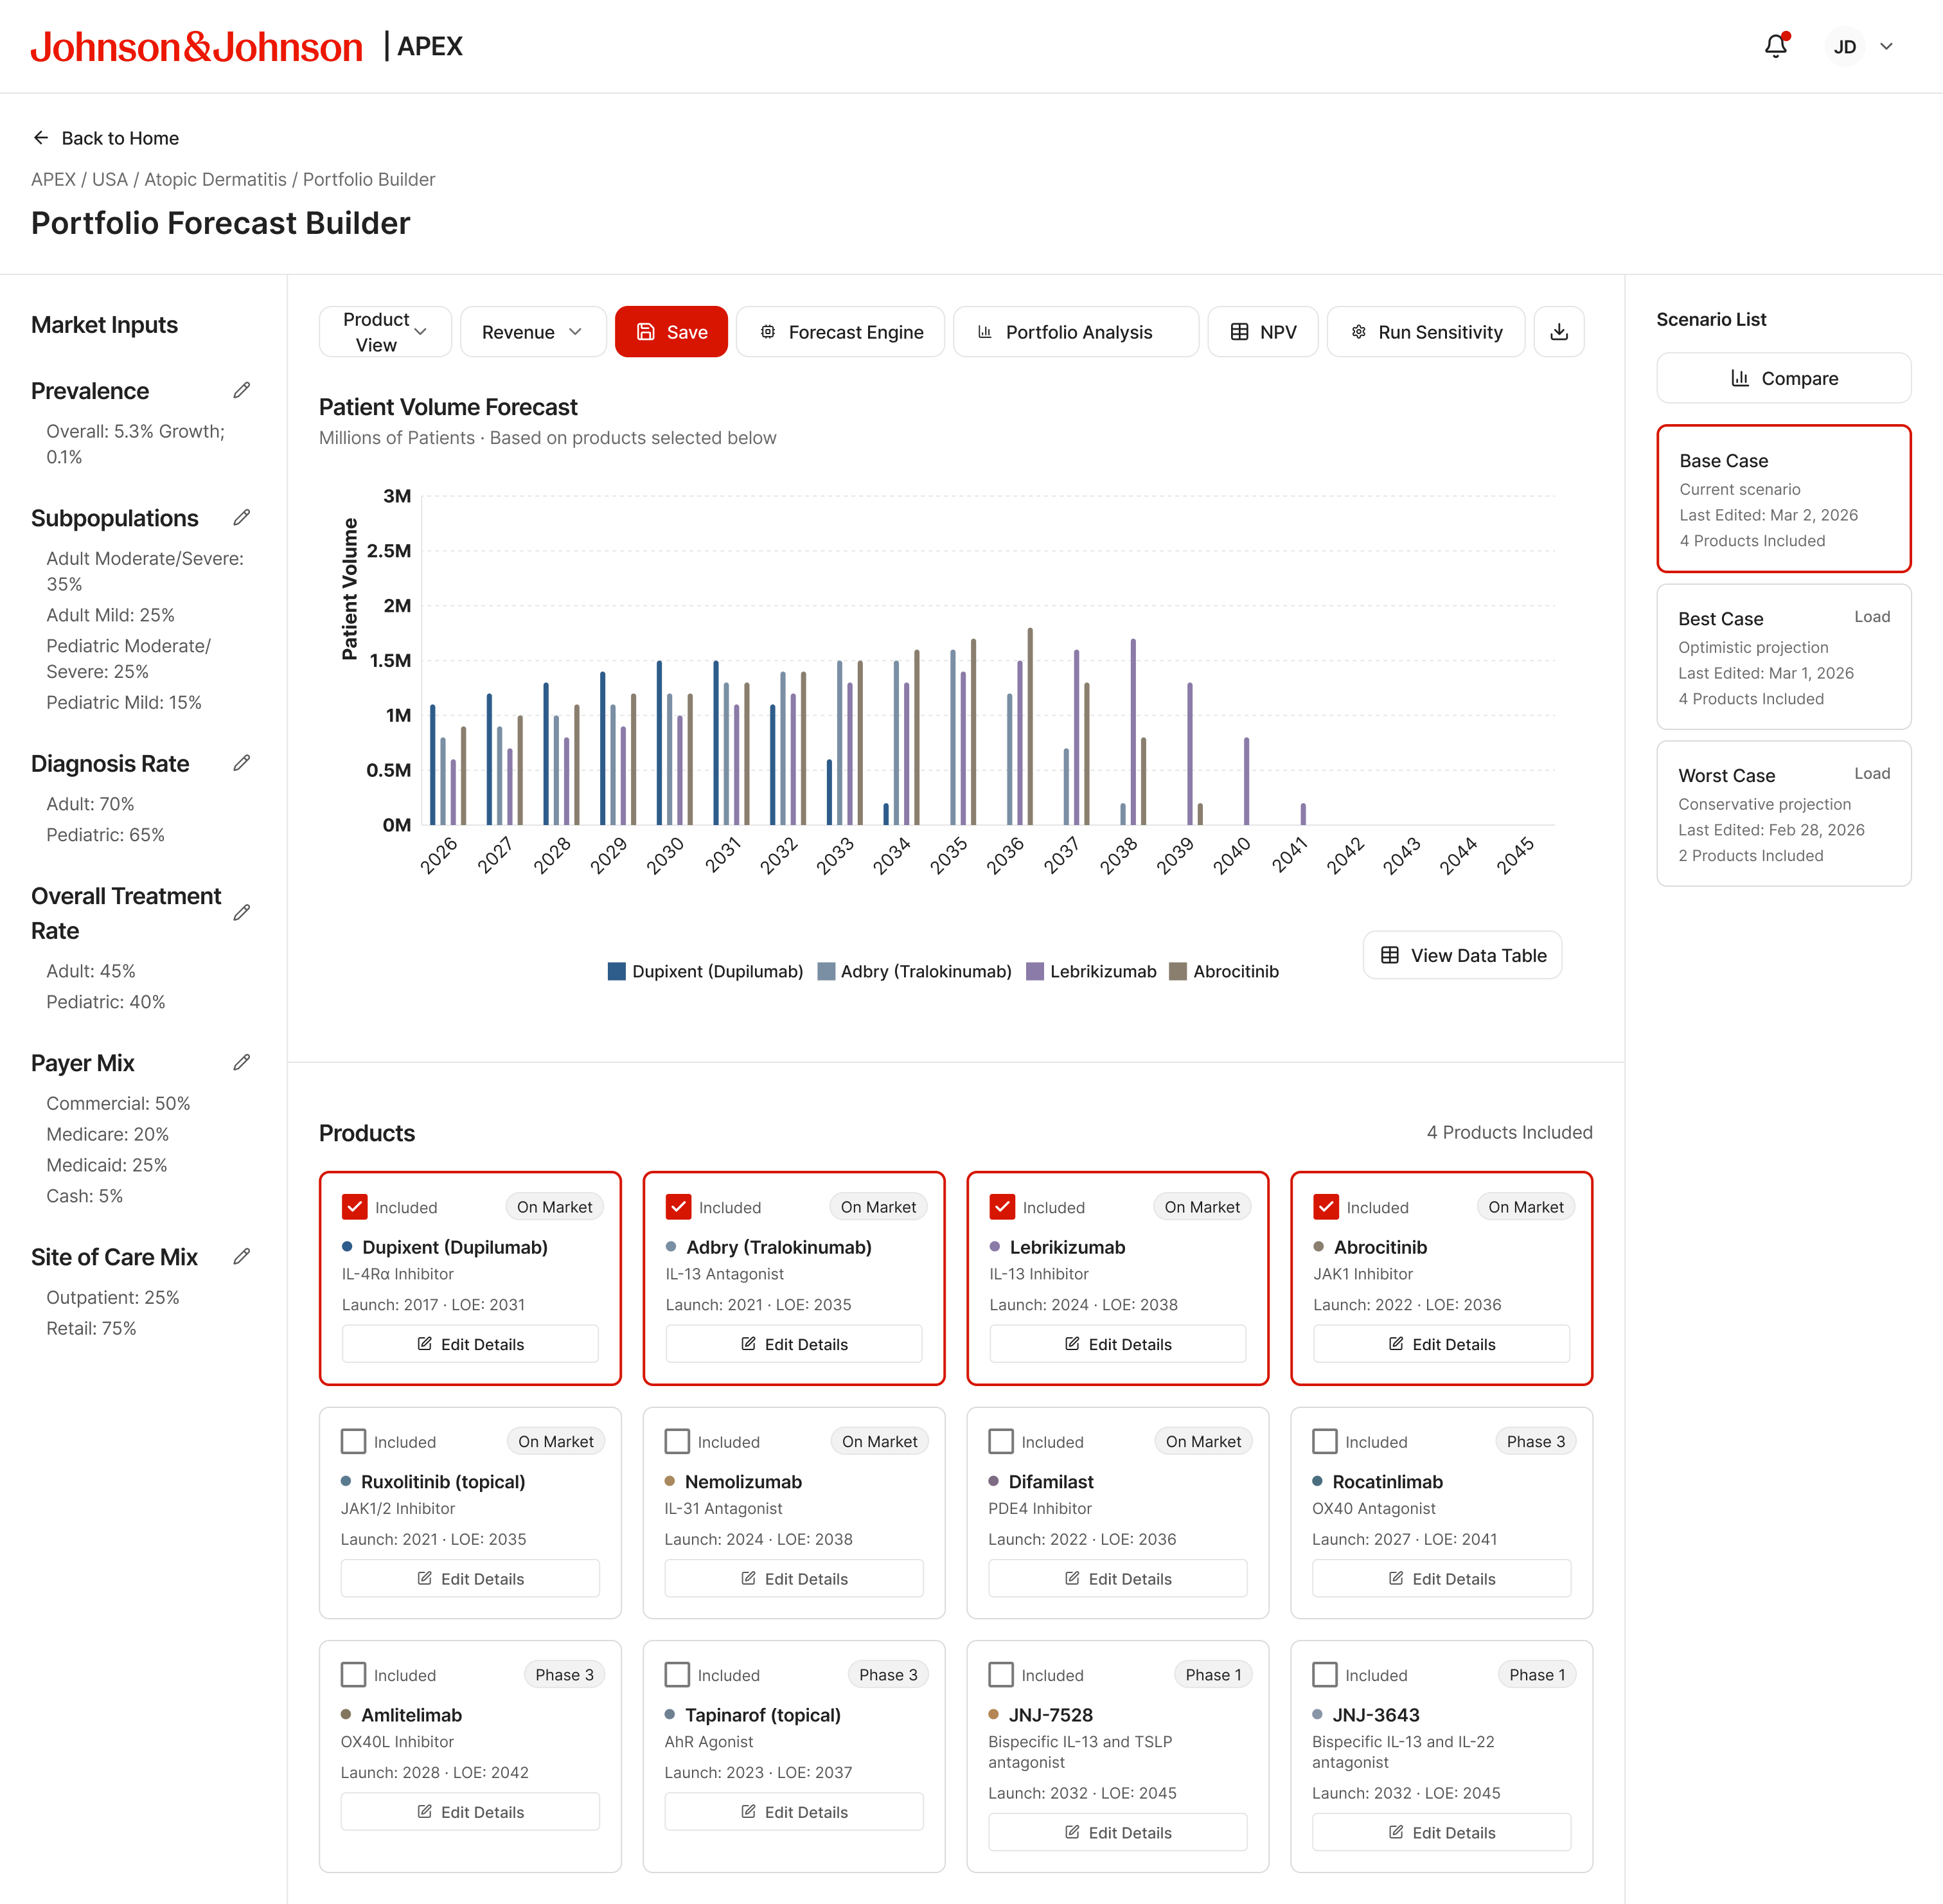
Patient Volume Forecast — 4 products, Base Case loaded
Builder states
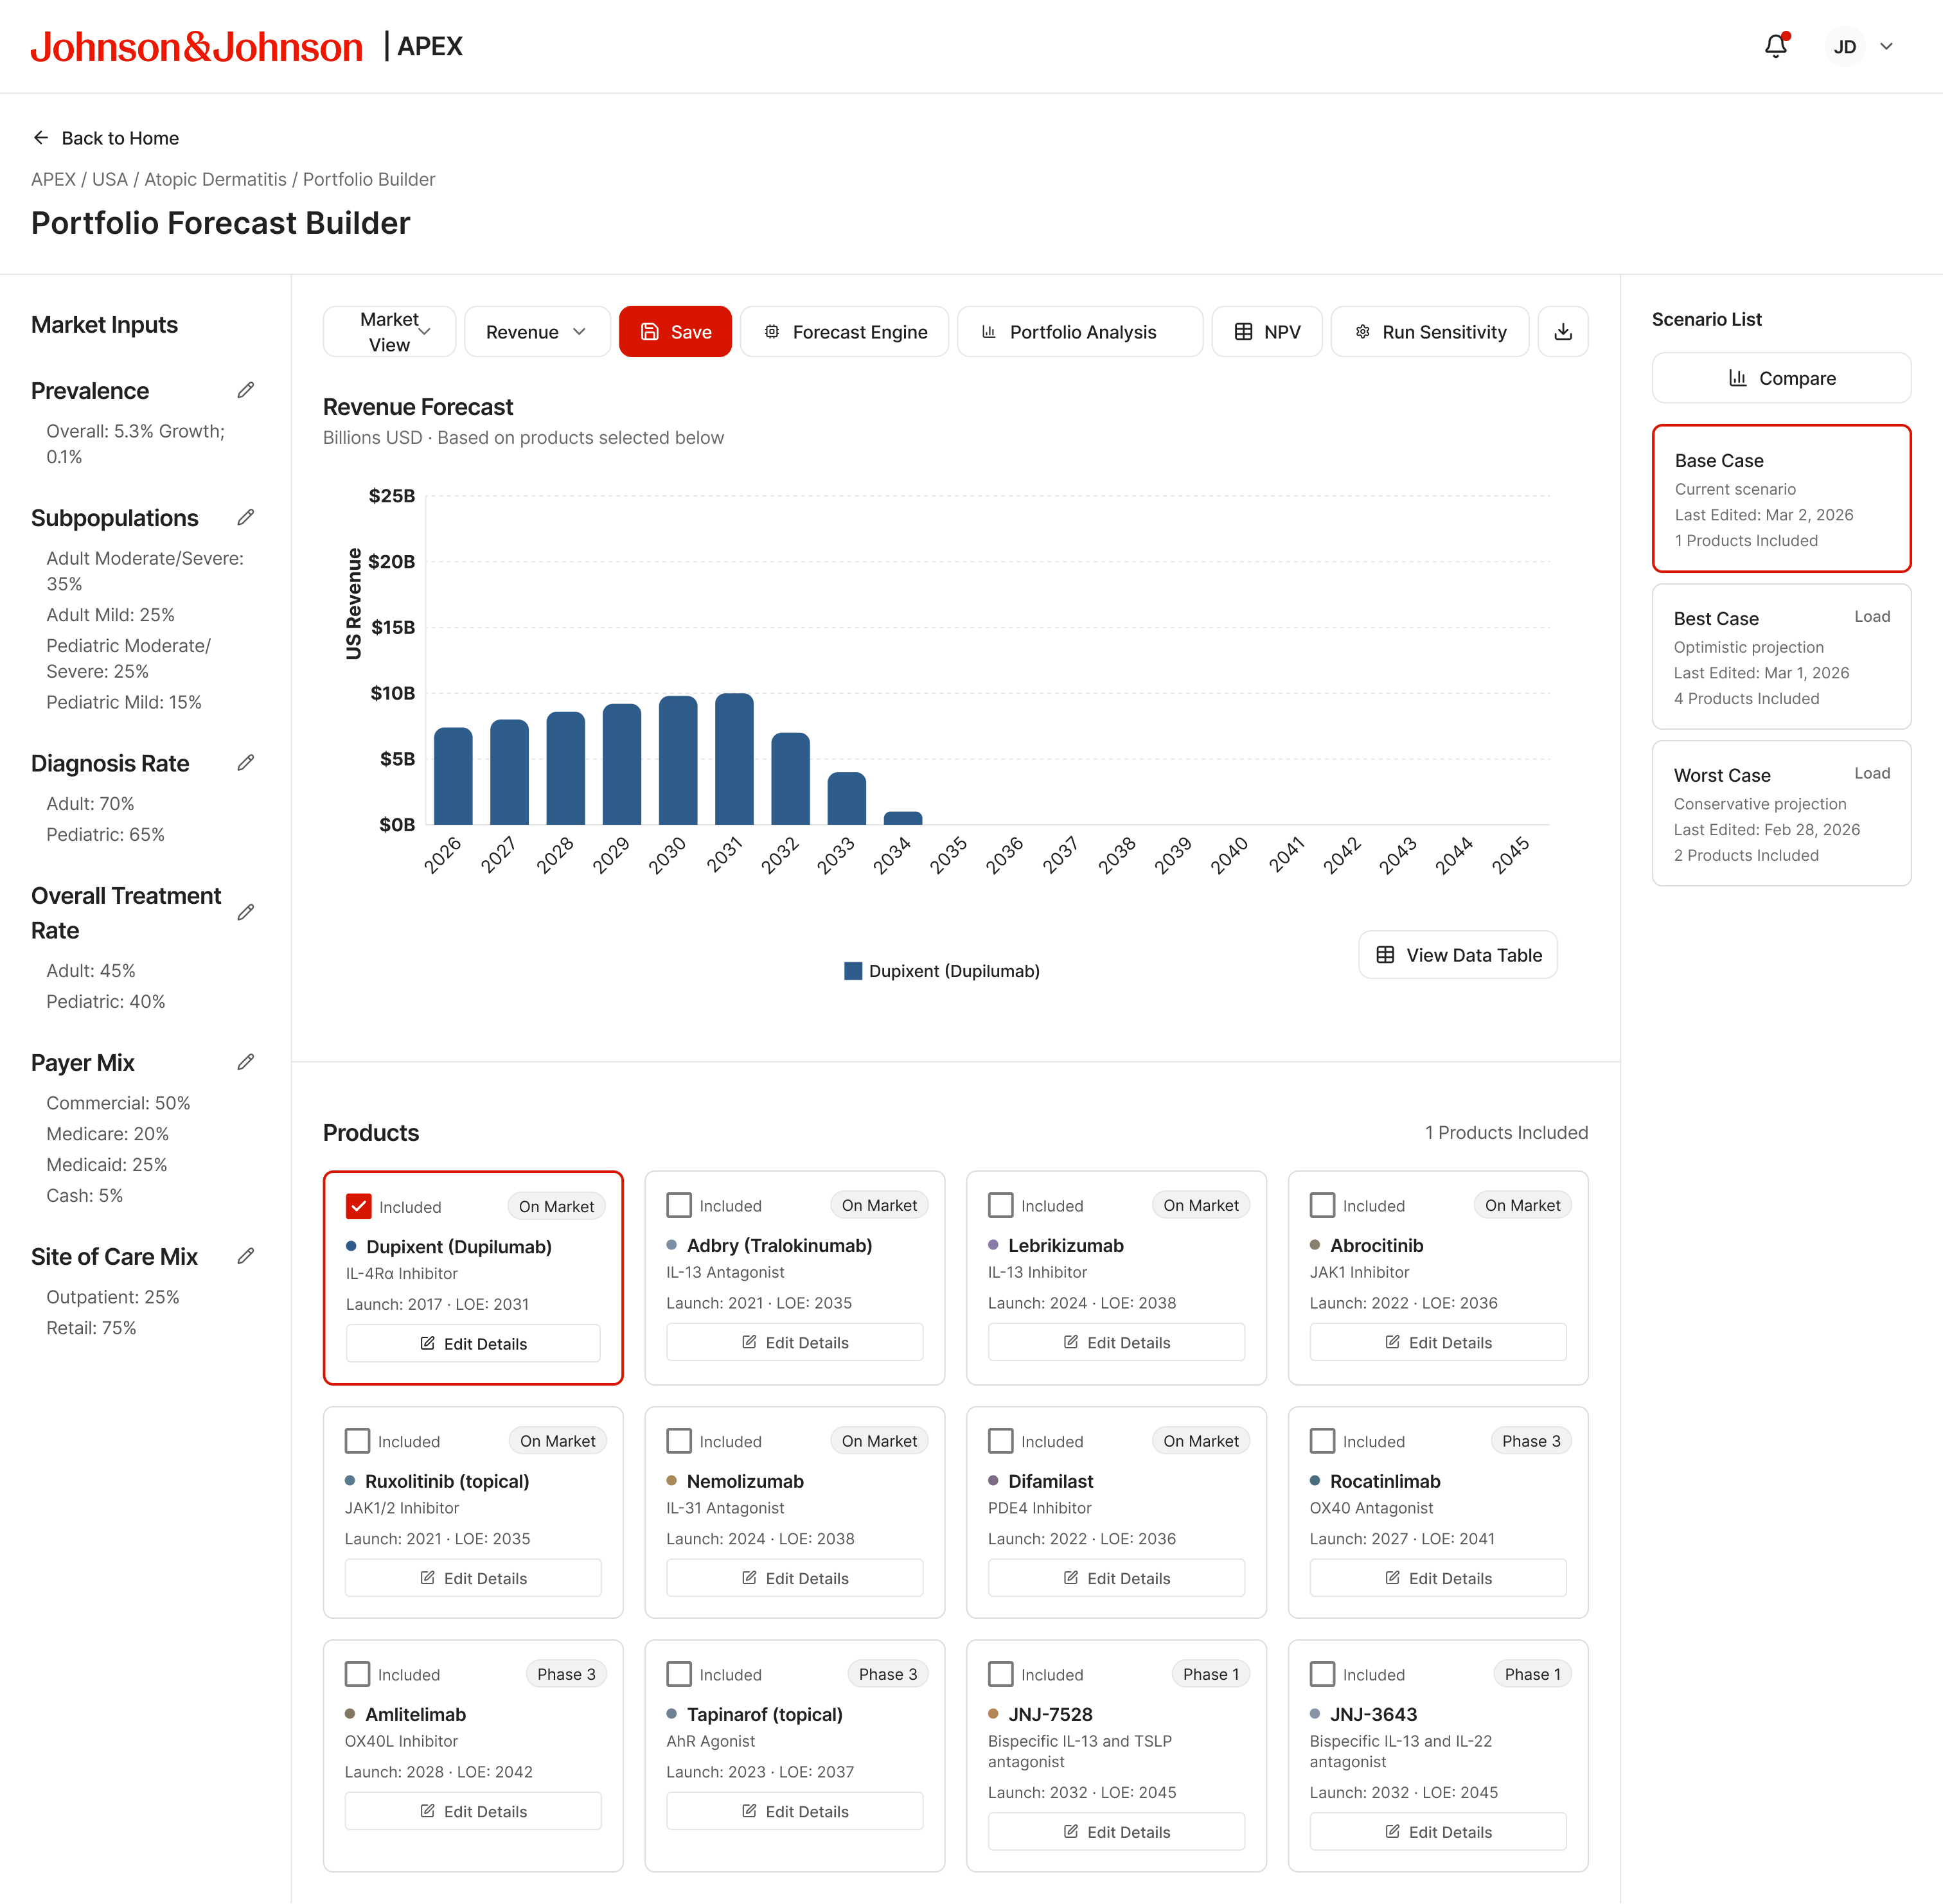
Revenue view — 1 product, market view
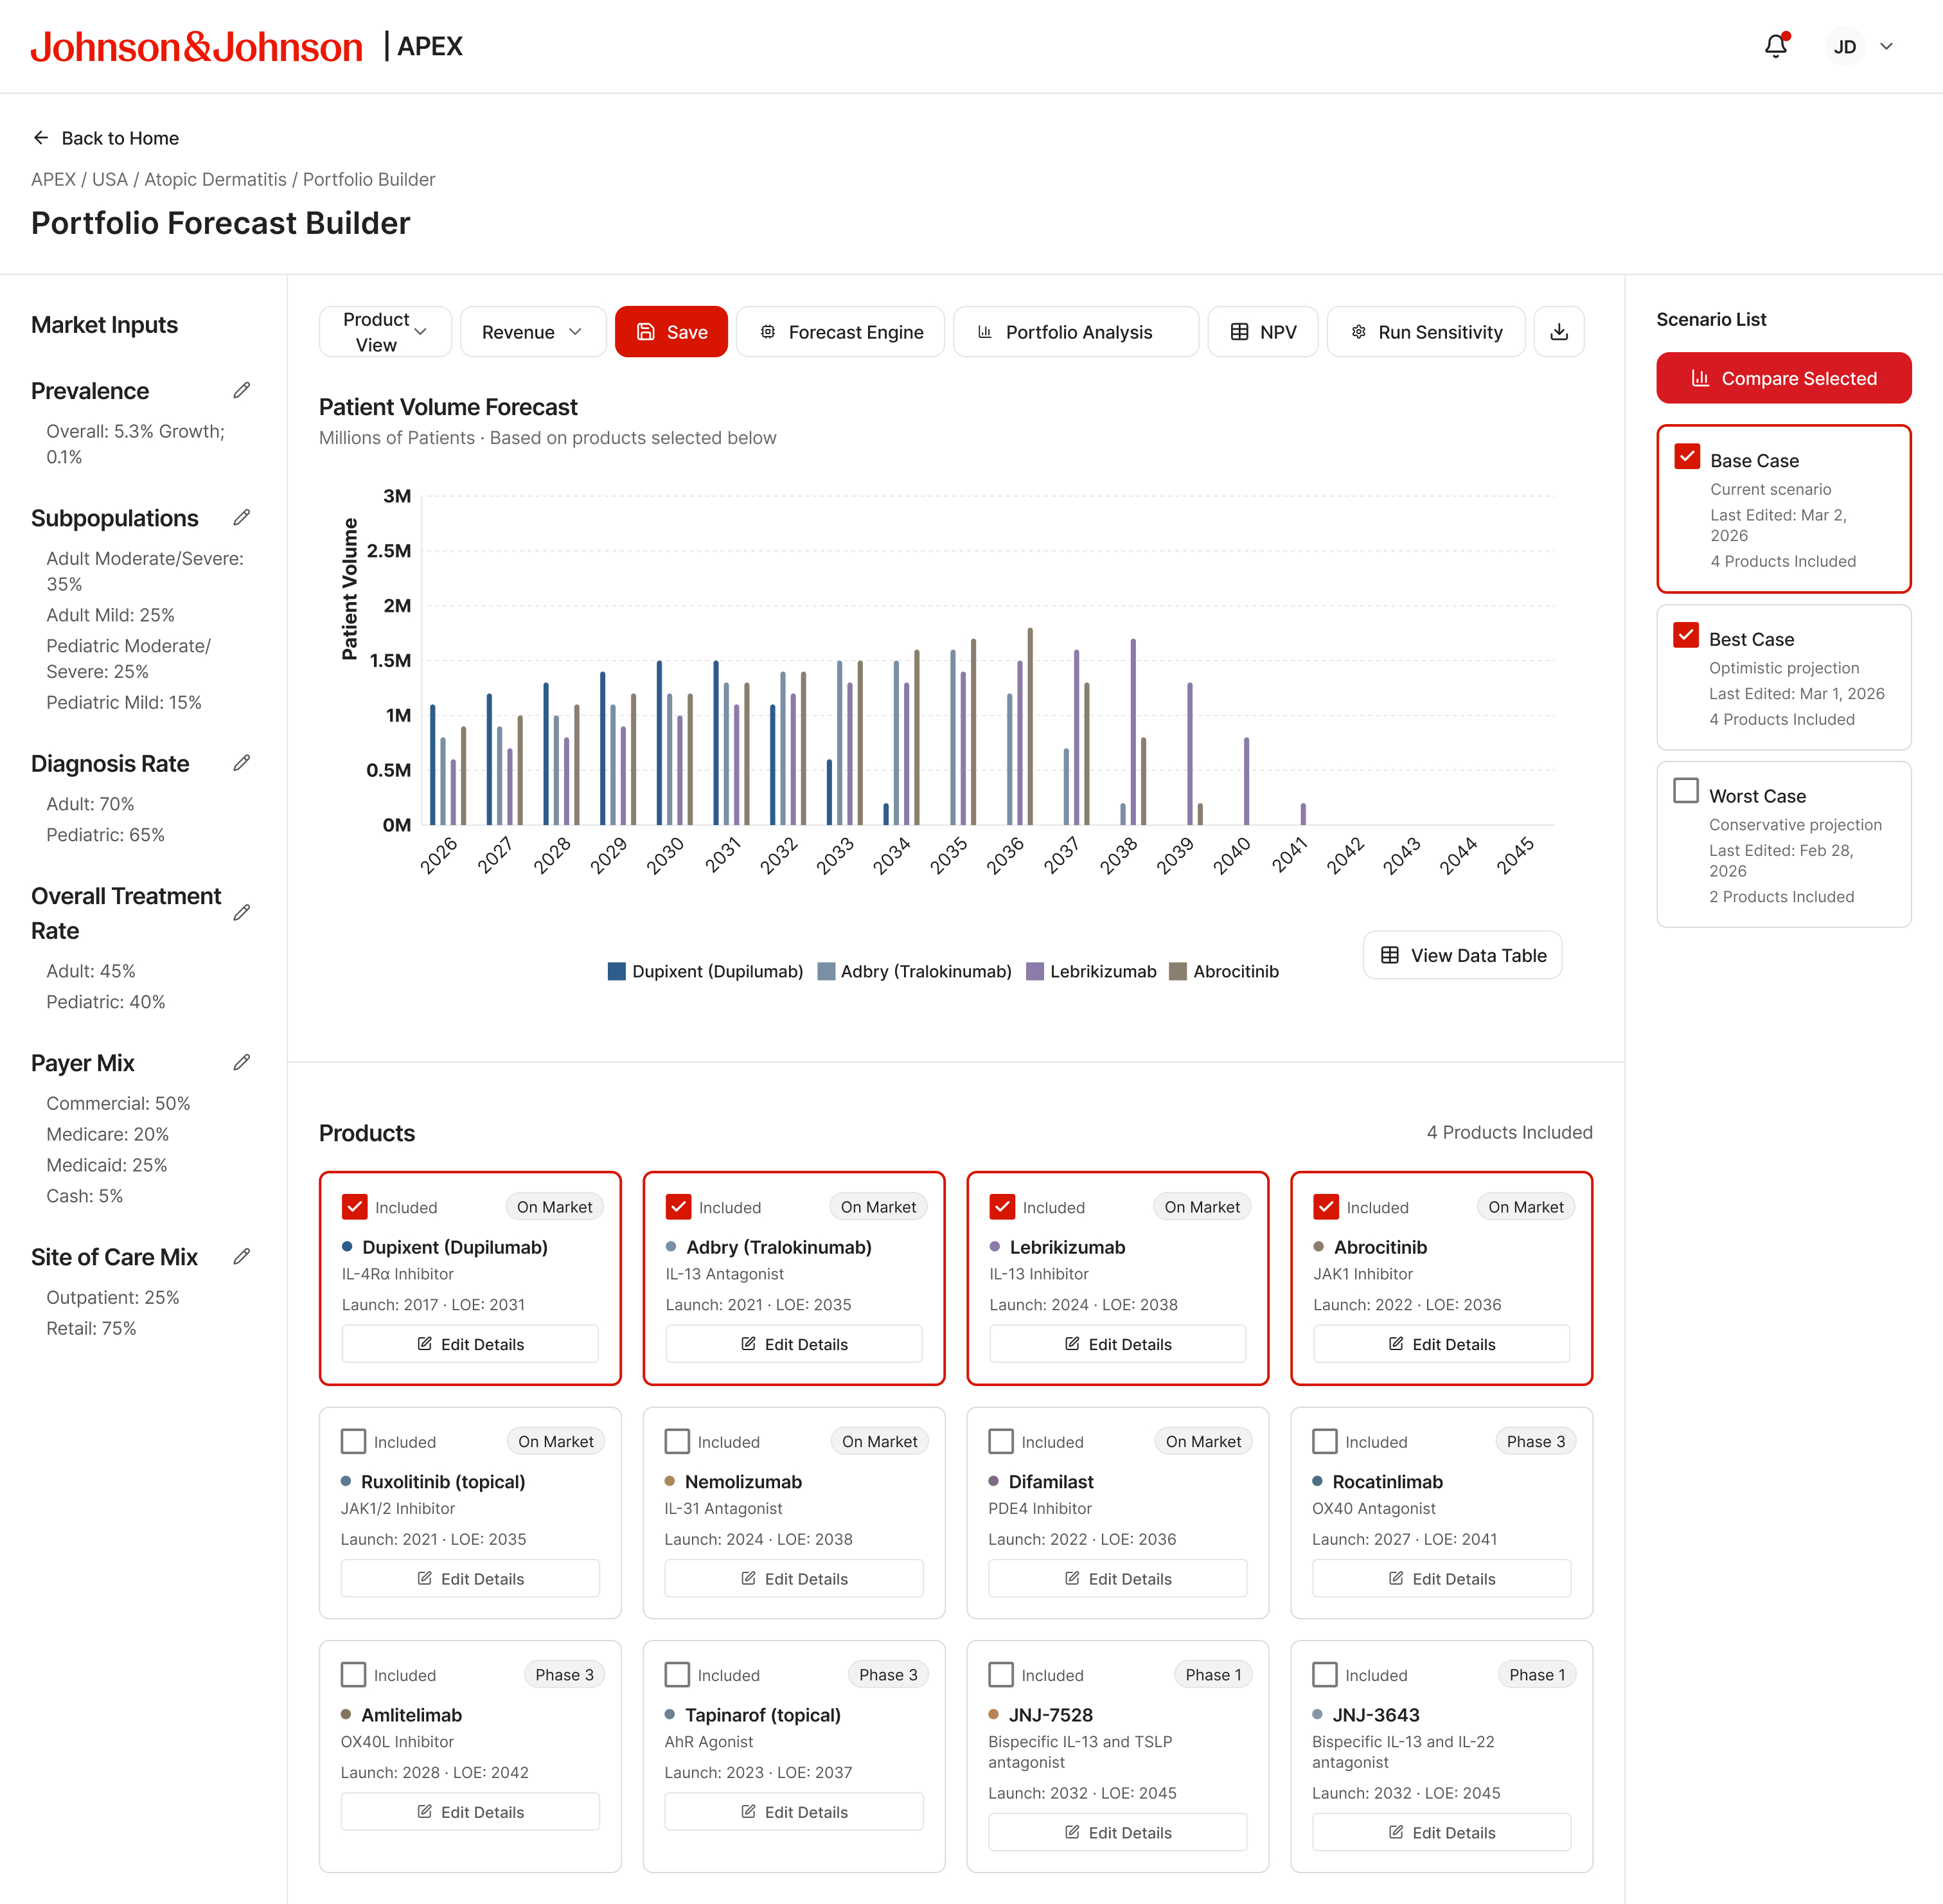
4 products, two scenarios checked — Compare Selected active
Scenario Compare
Two scenarios, one view
Compare mode loads when users select scenarios from the library and hit Compare. The chart switches to a multi-line overlay : Base Case renders darker, Best Case medium, Worst Case lighter. The layout stays inside the builder. Exit Compare returns to the last active state without losing the current product selection or view mode.
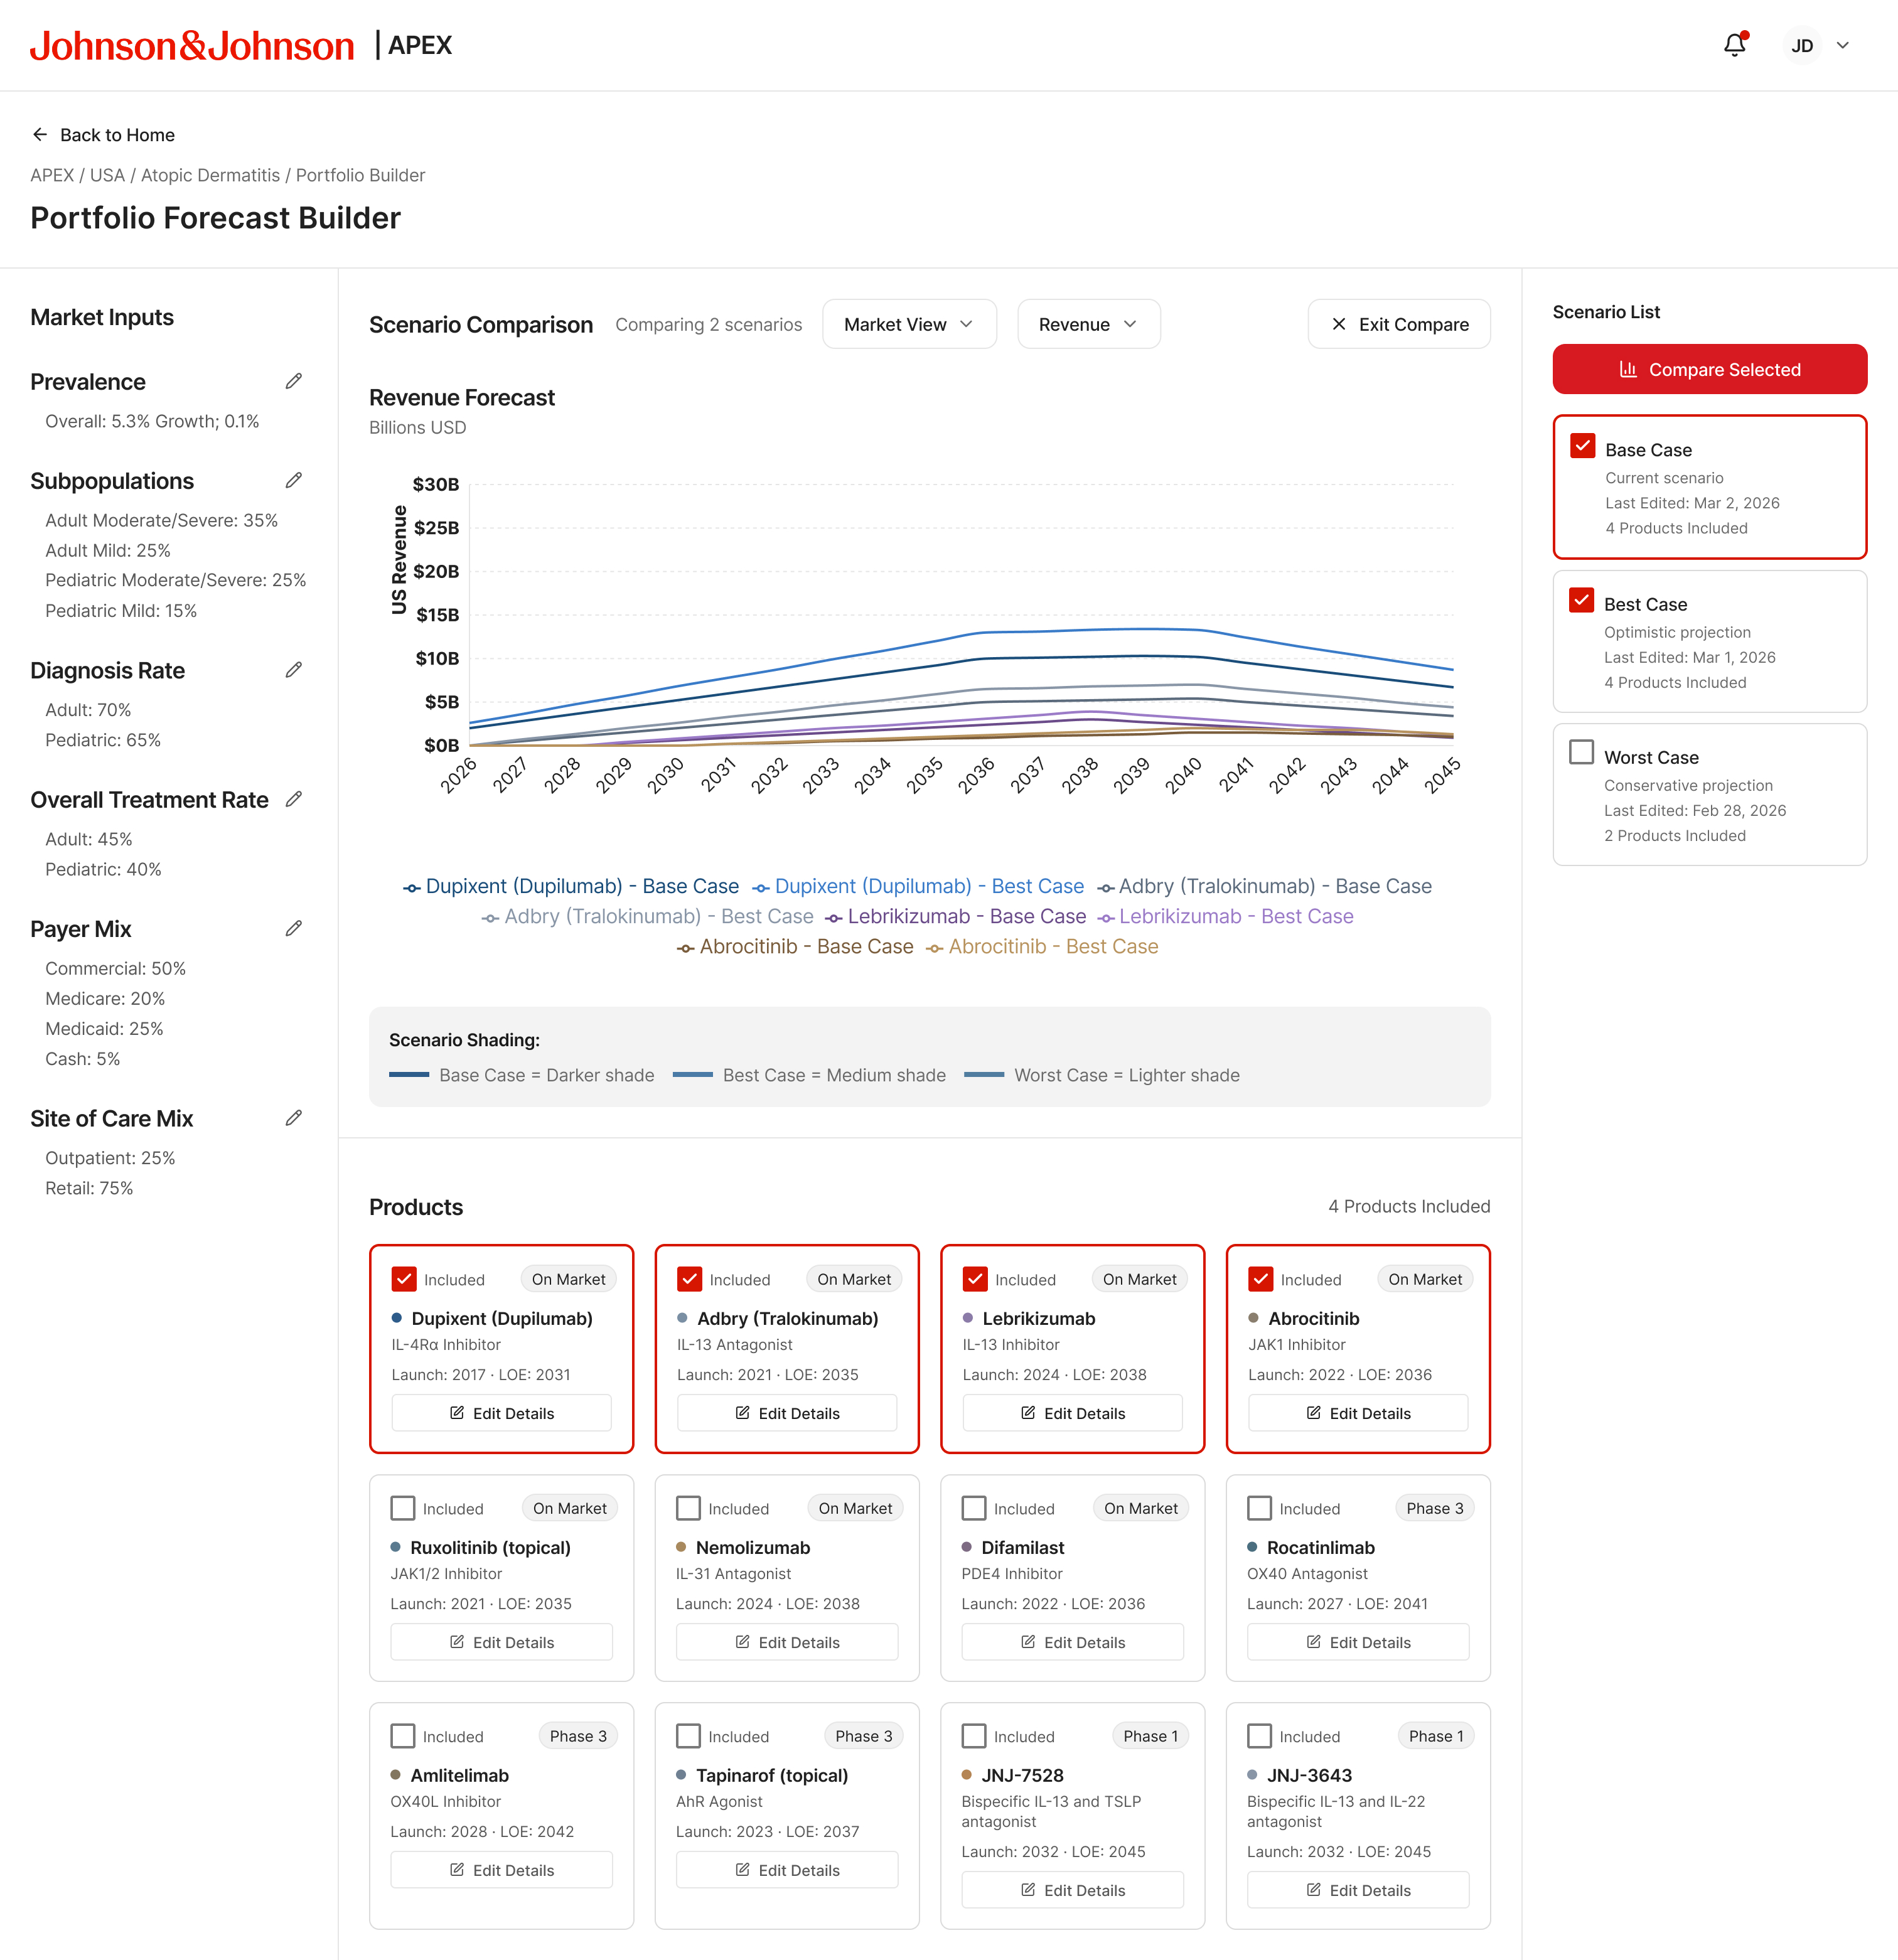
Revenue — Base vs Best Case overlay
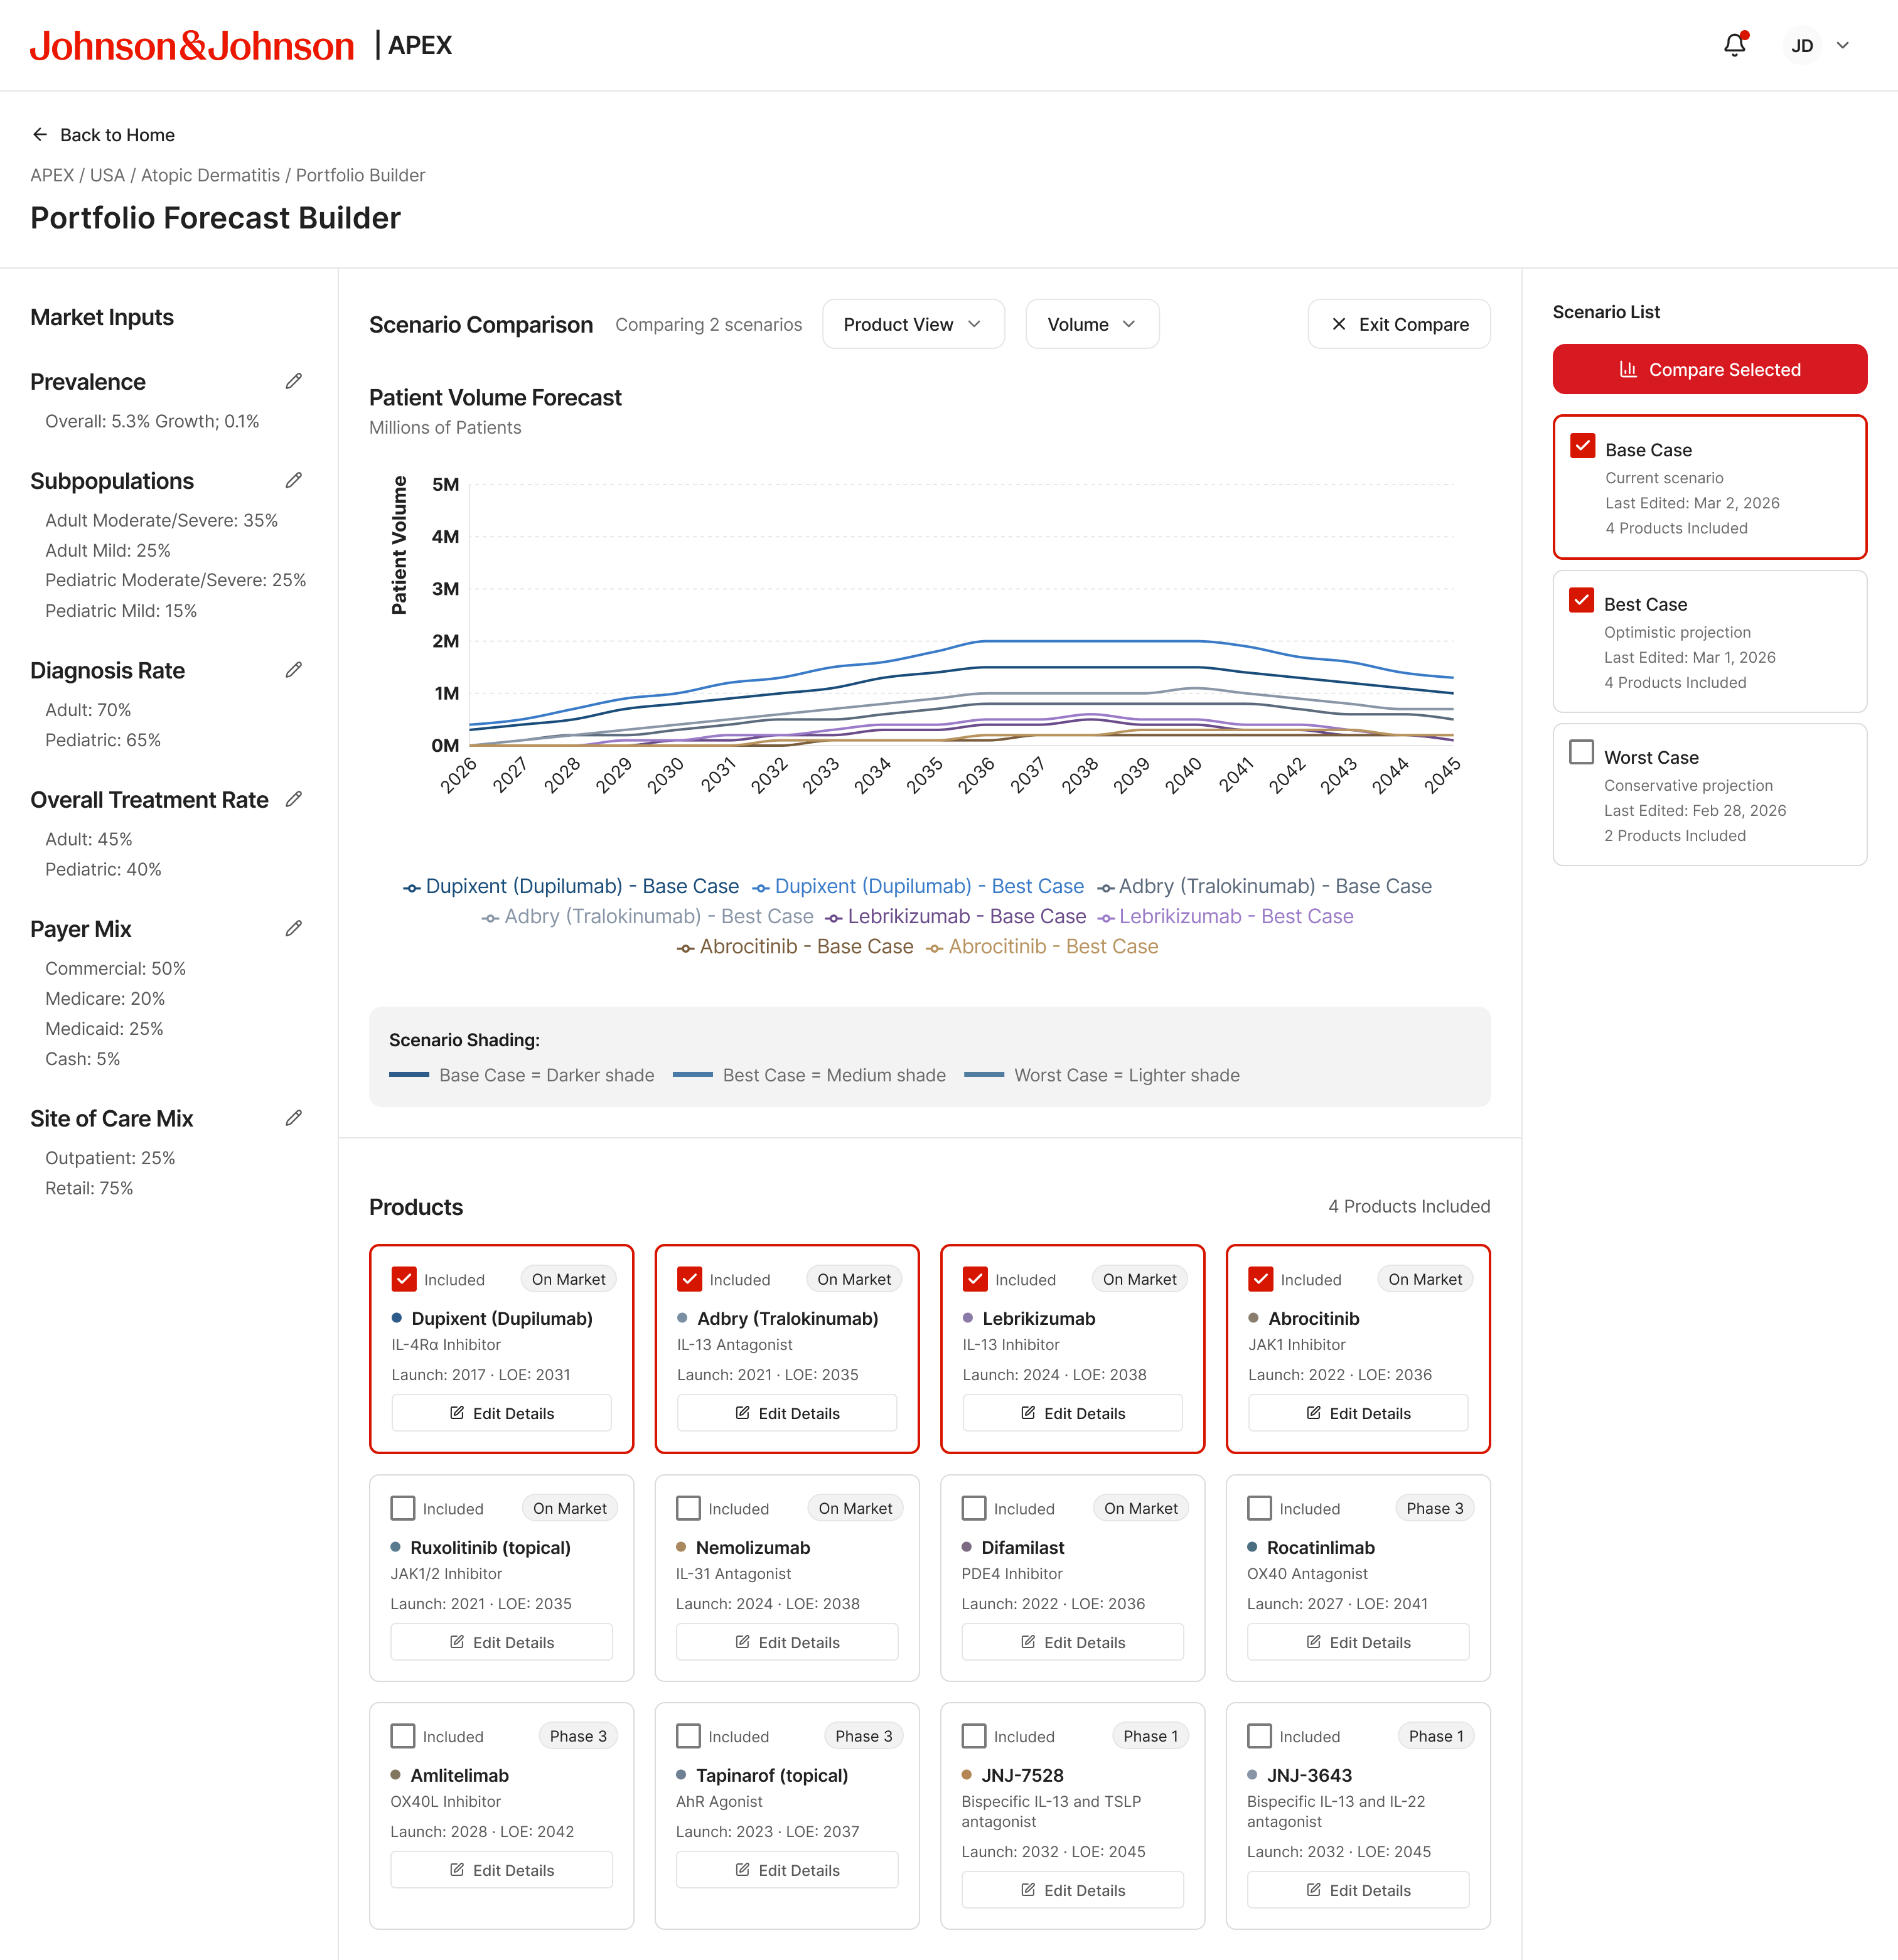
Volume — Base vs Best Case overlay
Market Intelligence Layer
The data behind the assumptions
The Market Map surfaces the epidemiological and competitive context behind every assumption. Four views cover the full picture:
- Total Prevalence — overall population trajectory
- Subpopulation — Moderate, Severe, Pediatric, Refractory segments
- Payer Mix — Commercial, Medicare, Medicaid, Other breakdown
- Product Treatment Rates — competitor landscape by drug
The Market Insights panel on the right tracks the current selection with market size, growth rate, and key drivers.
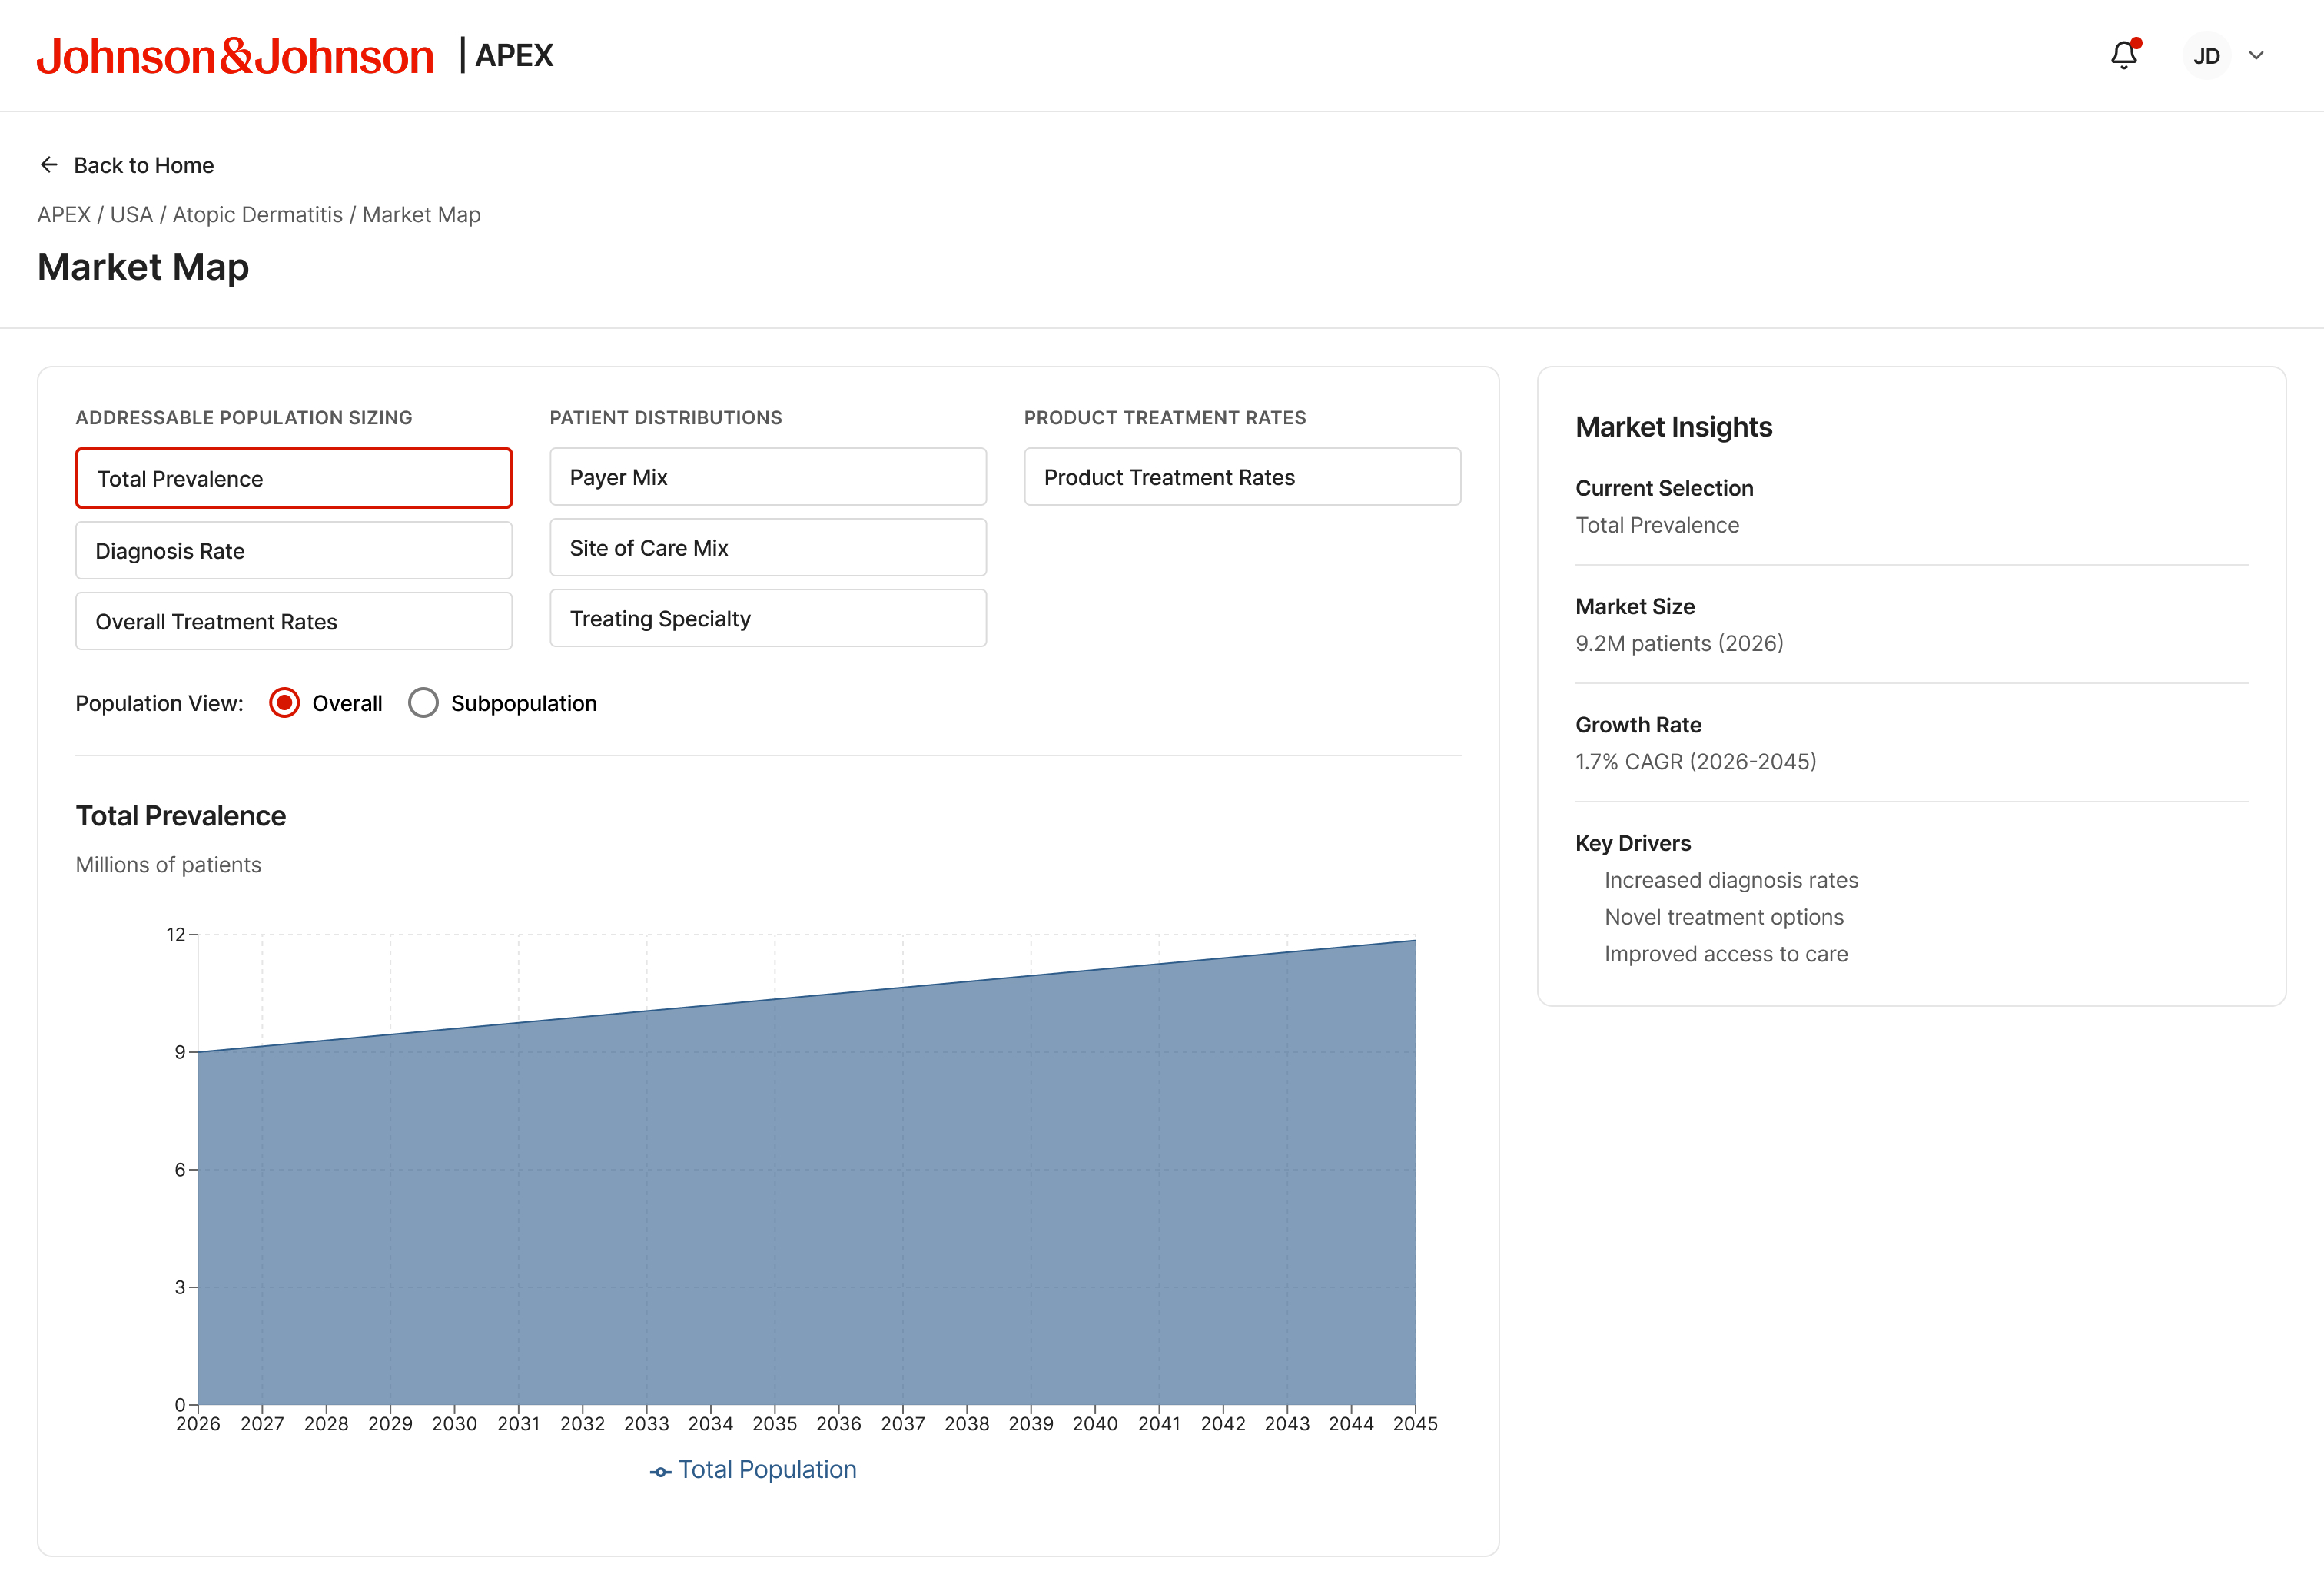
Total Prevalence — Overall population view
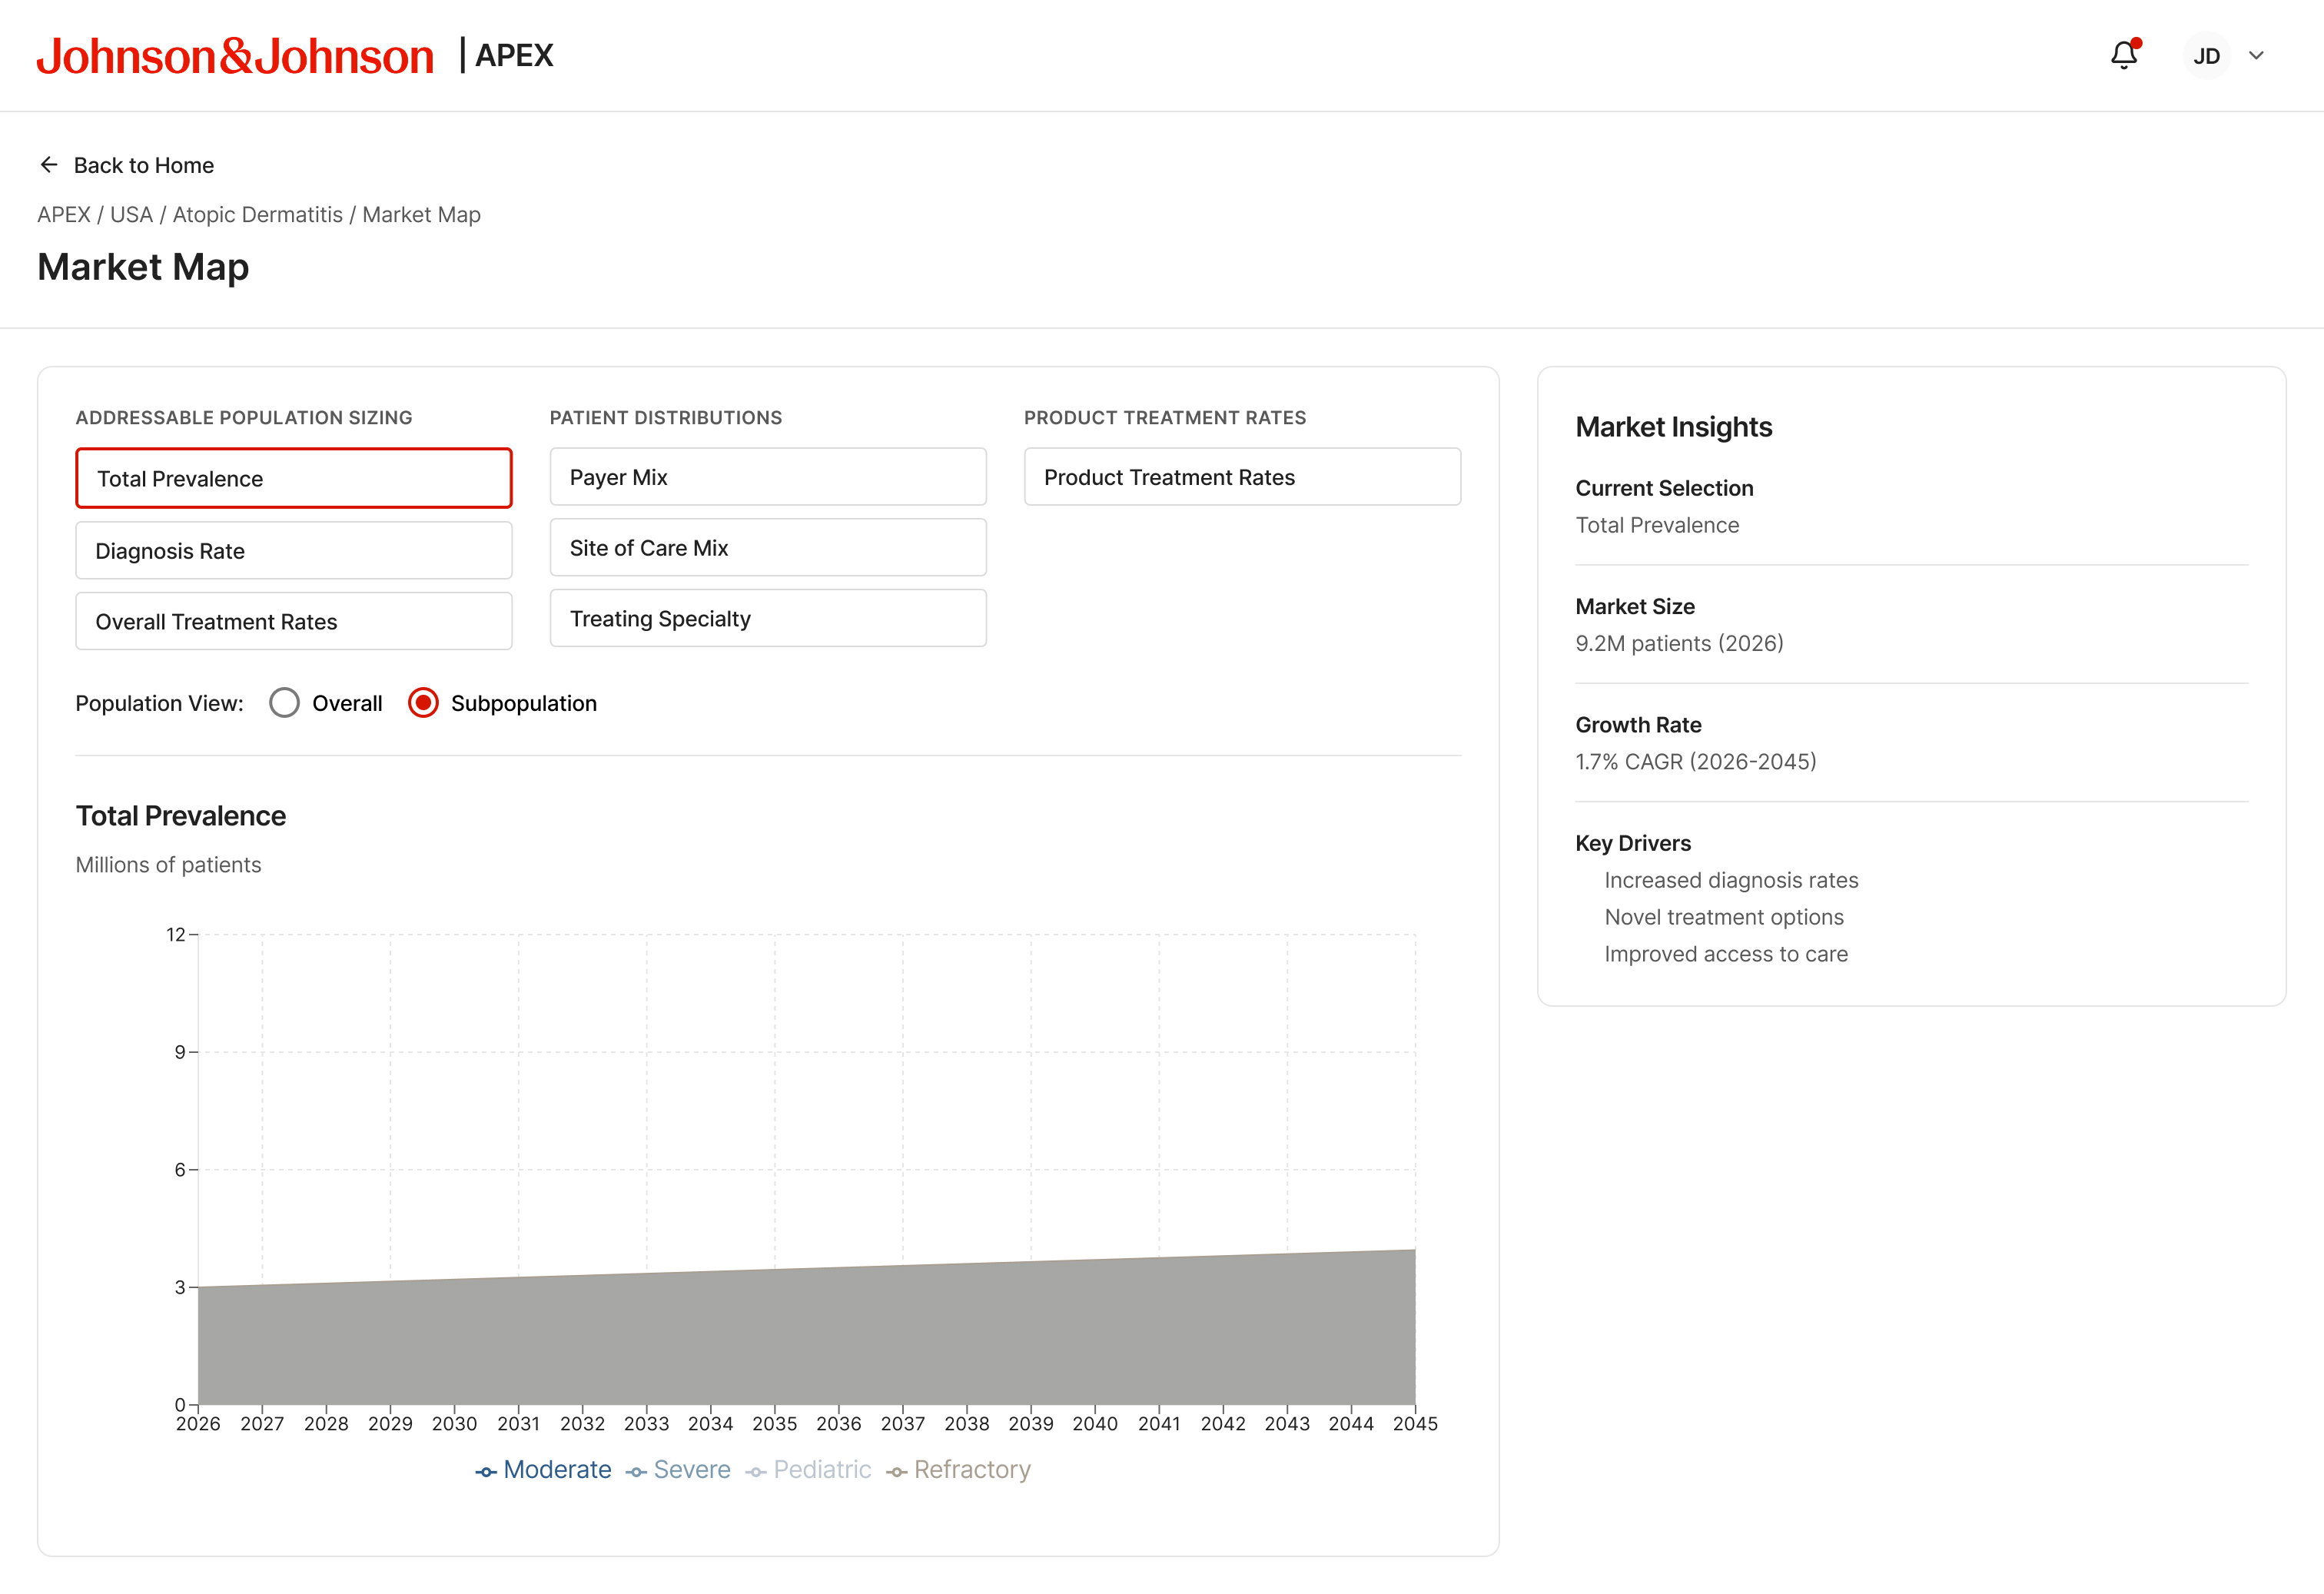
Total Prevalence — Subpopulation breakdown
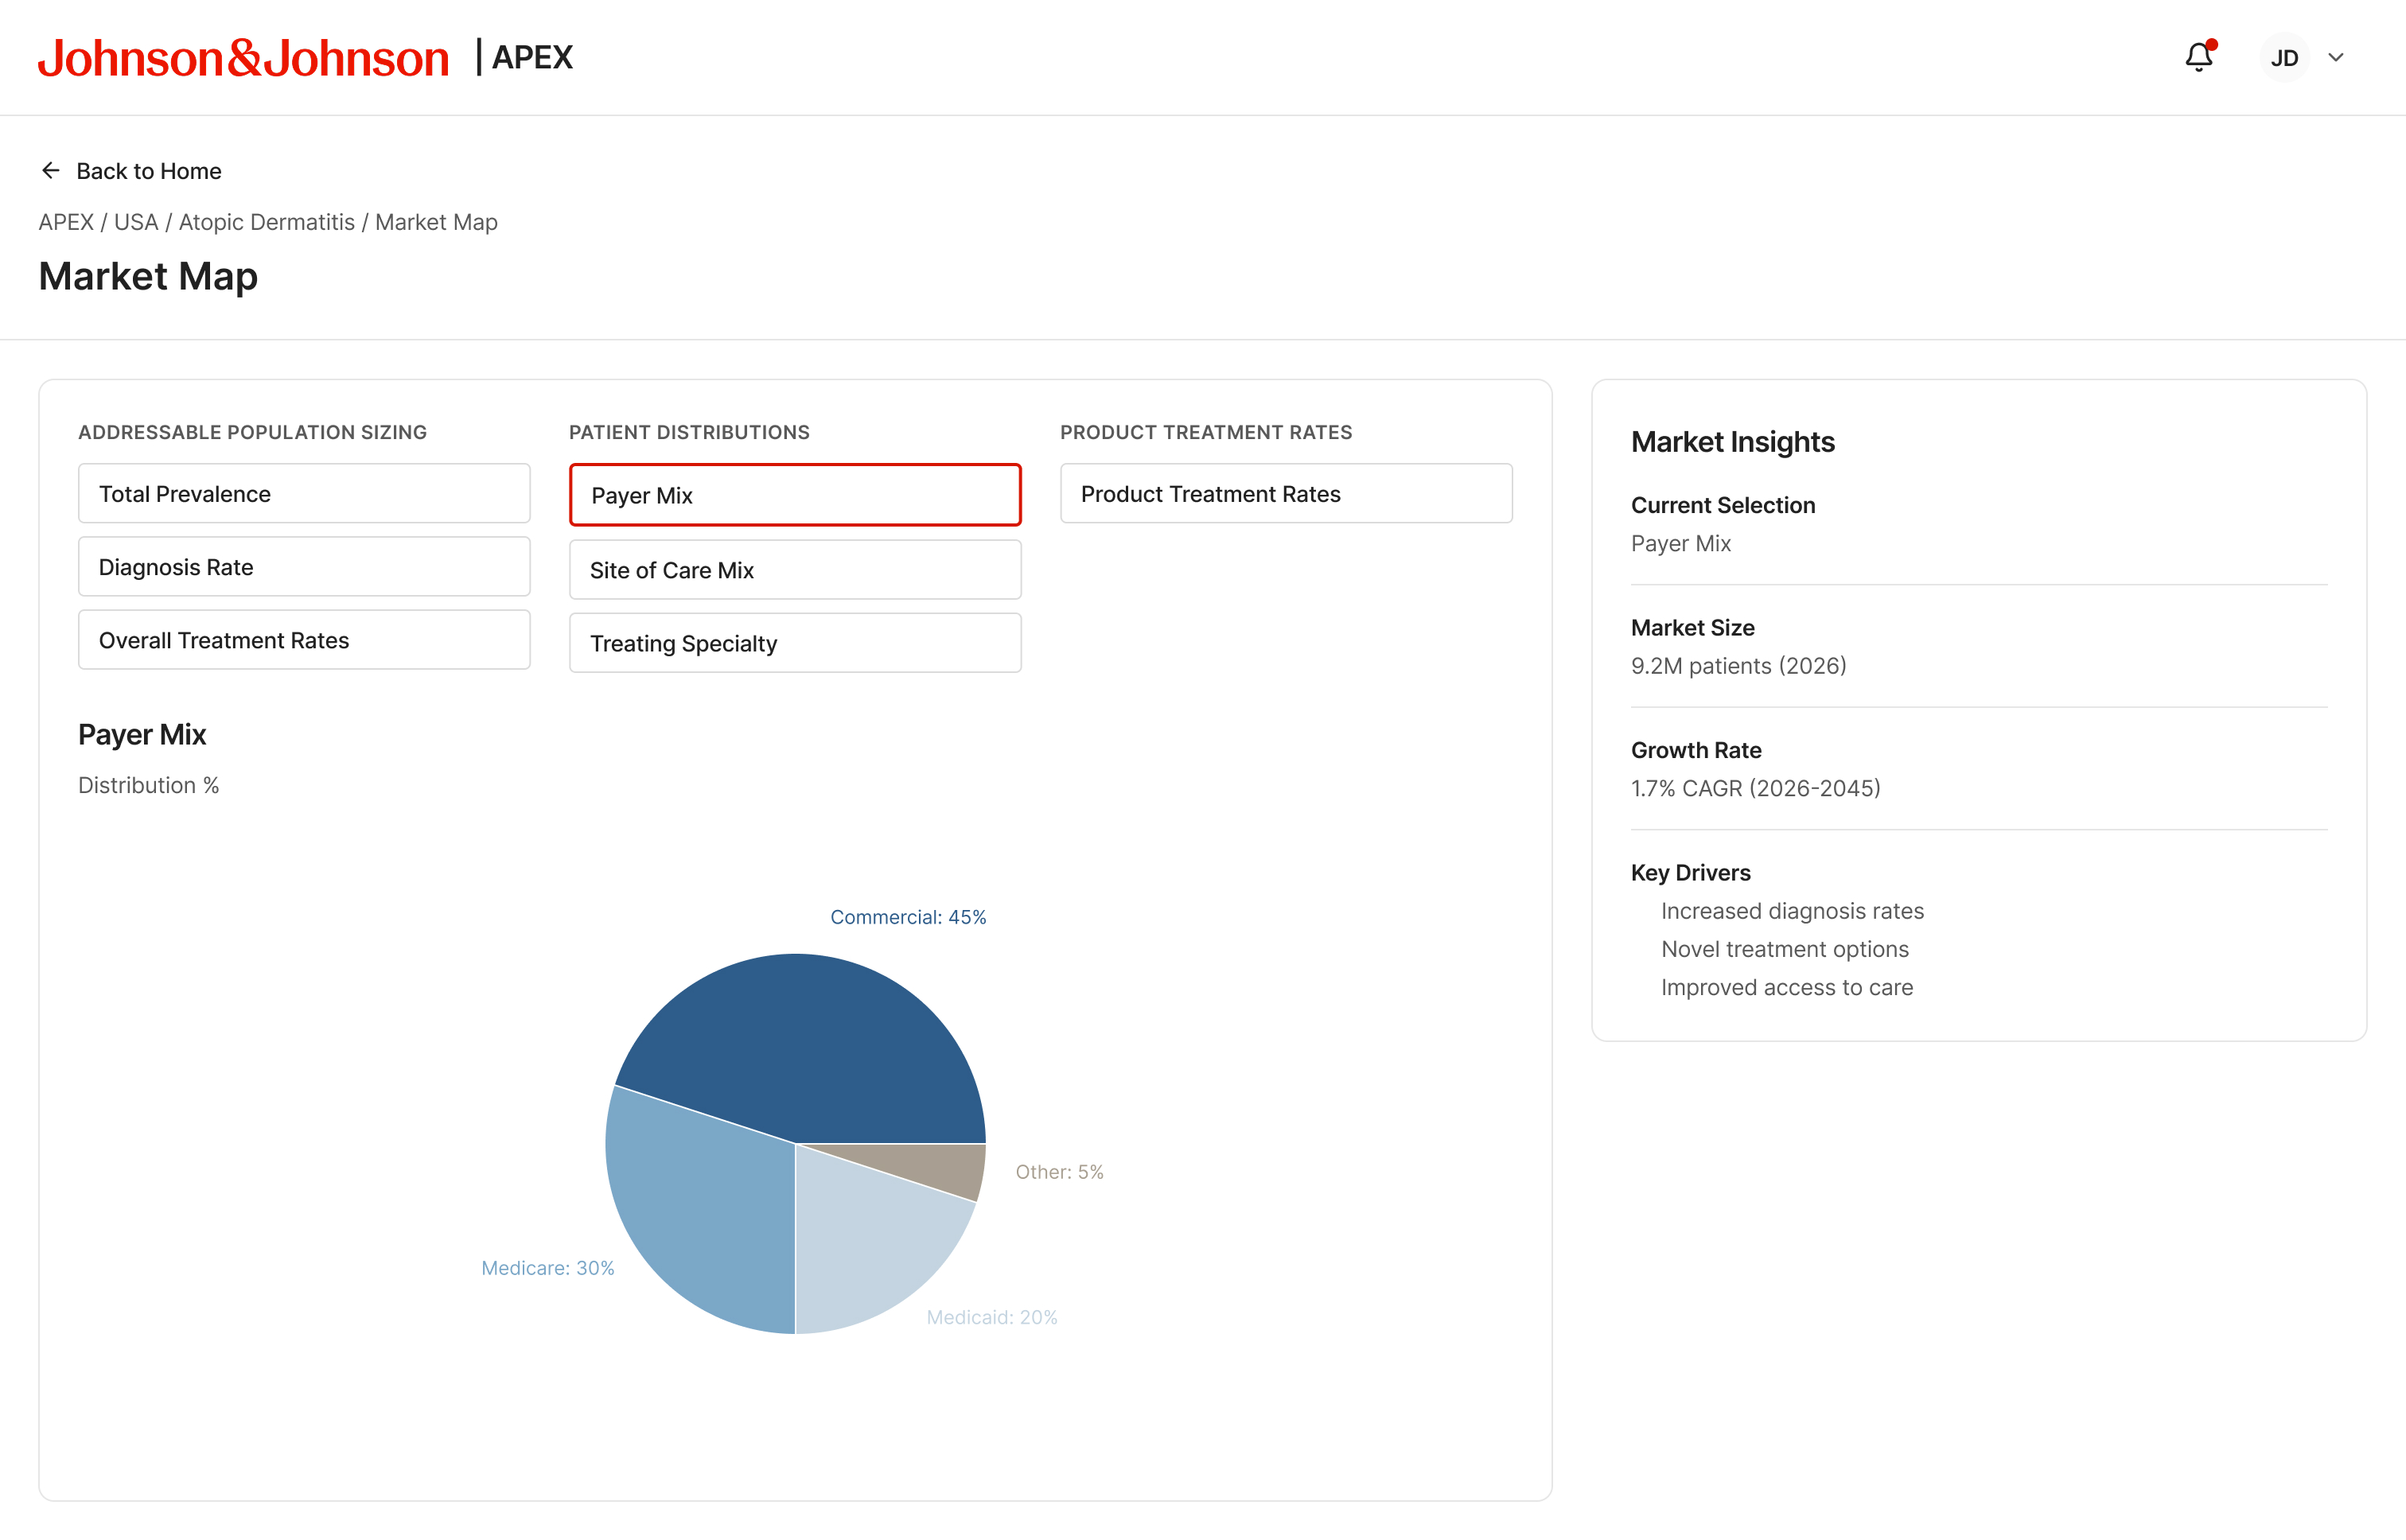
Patient Distributions — Payer mix
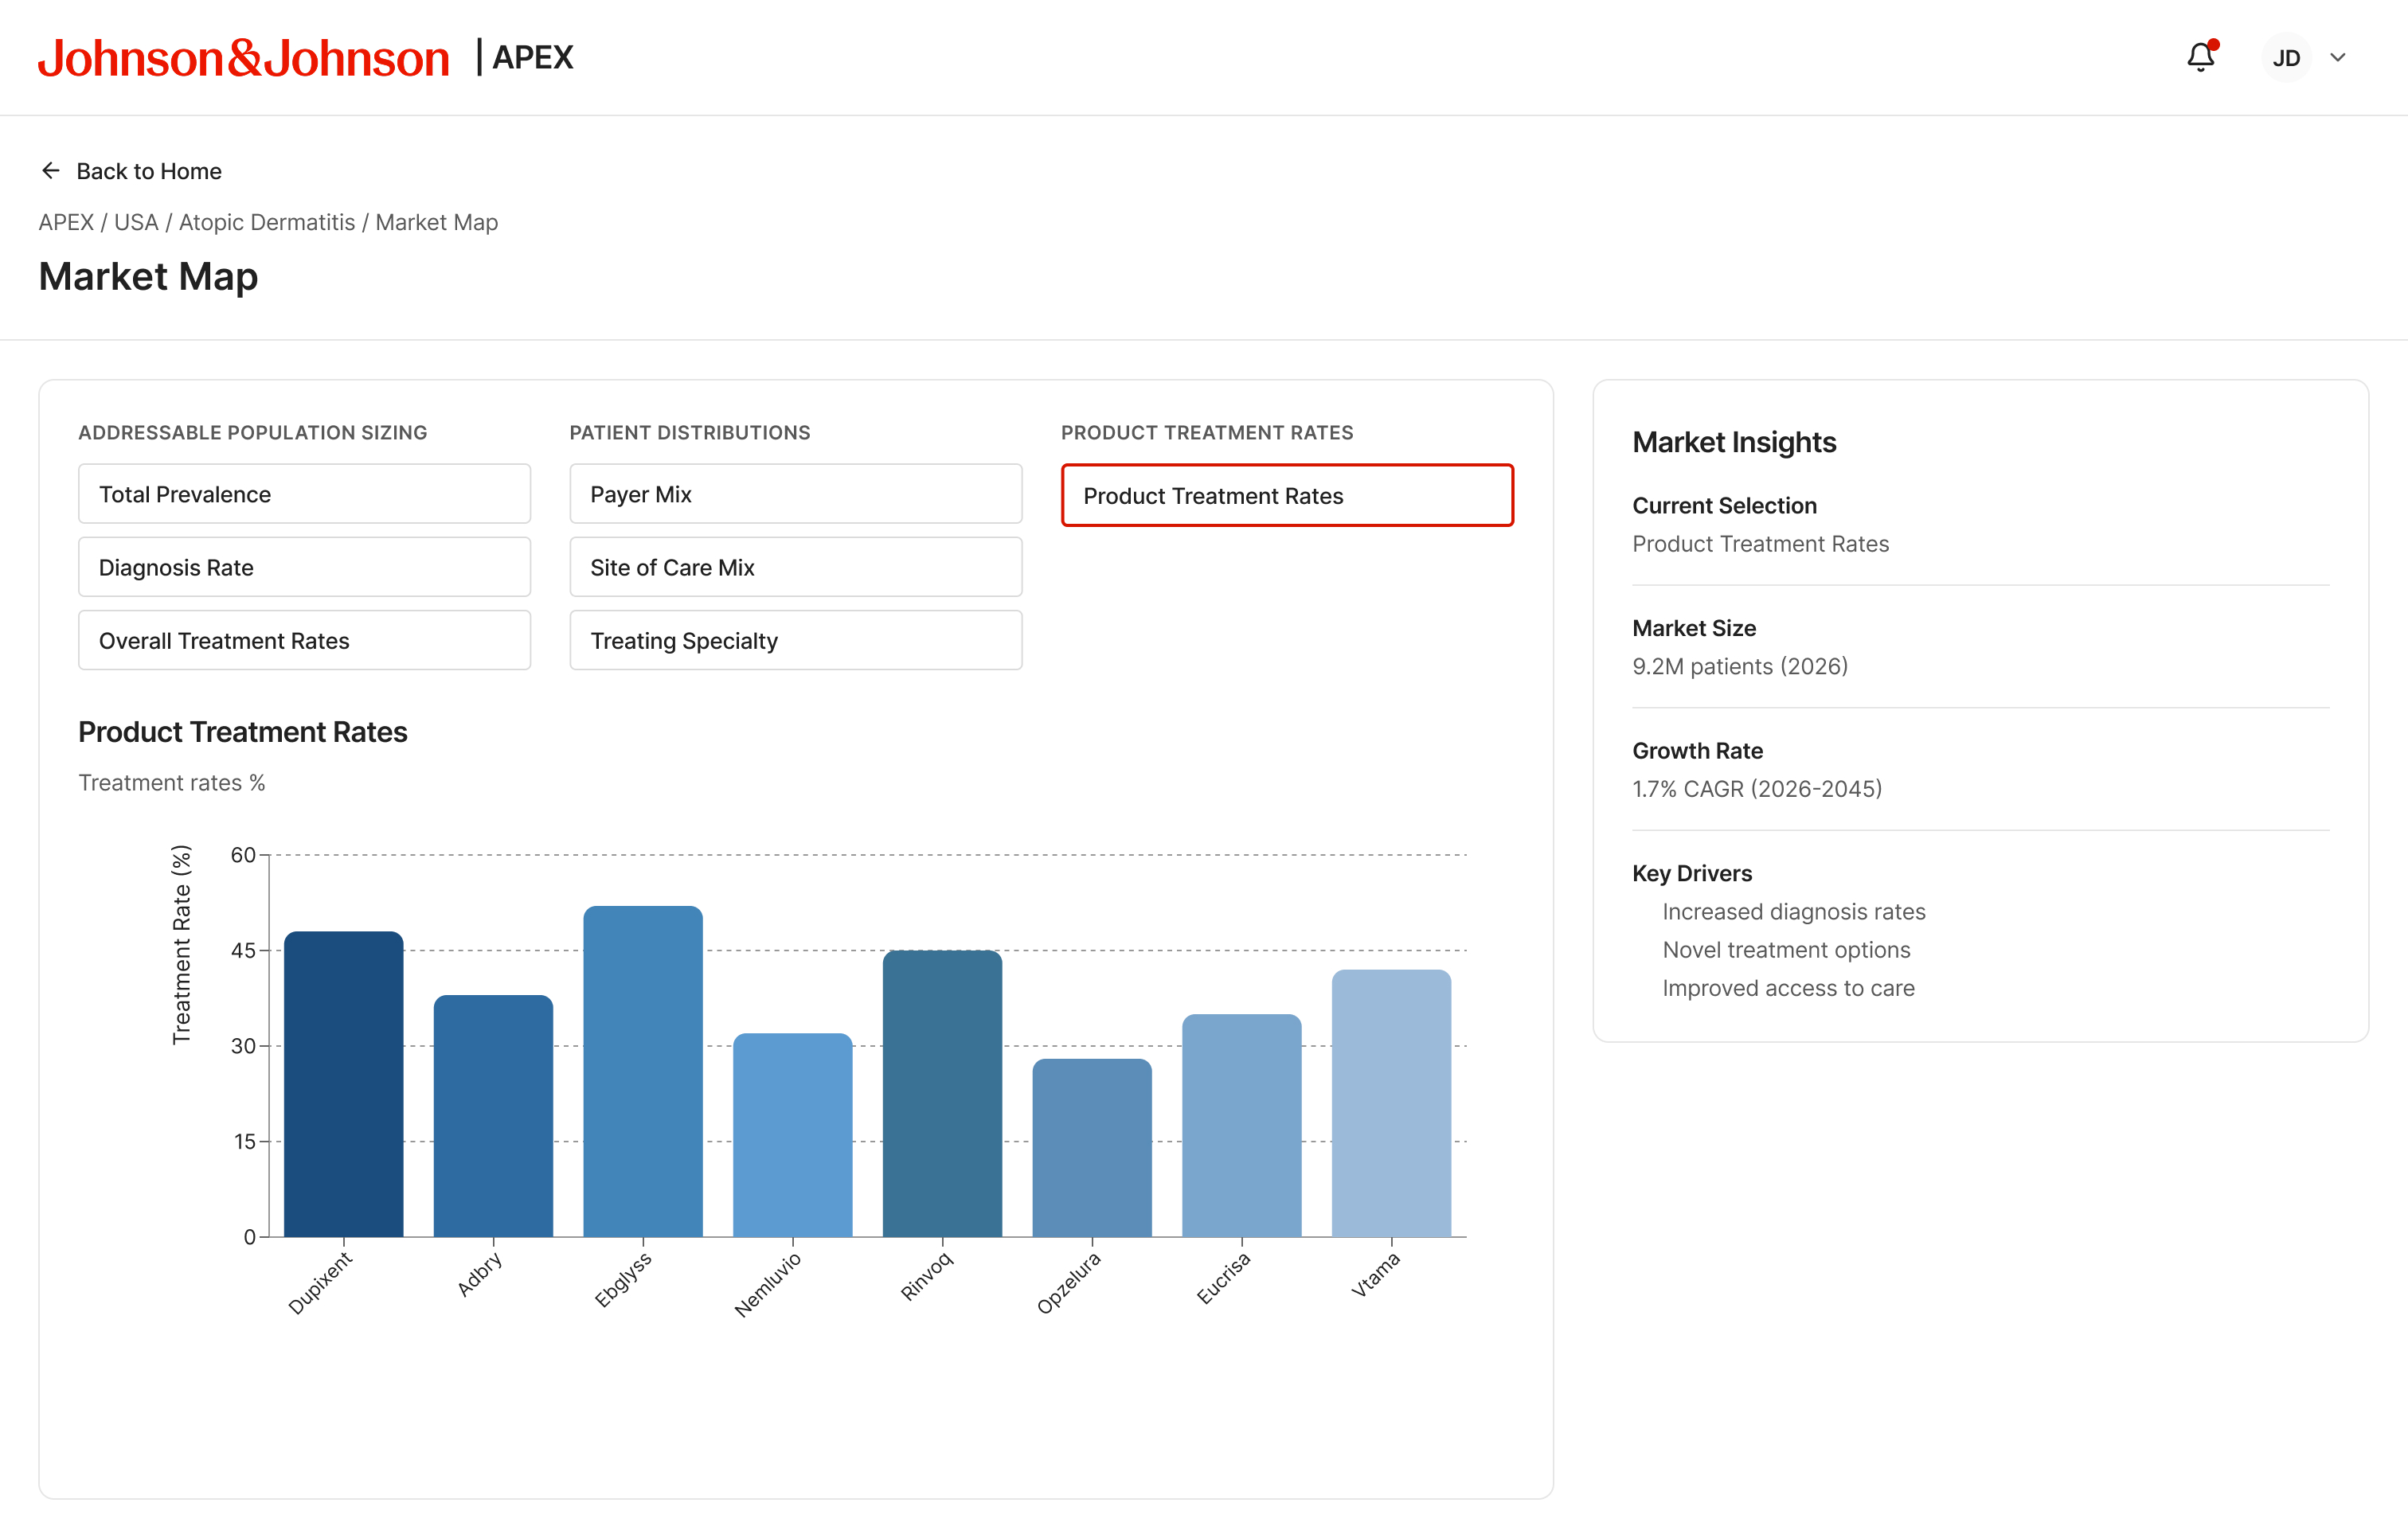
Product Treatment Rates — Competitor landscape
Assumption Editing
Every input is explicit, every source is linked
Six modal forms cover the full market input stack. Each follows the same structure: current value, future value (with a target year), and a source field backed by a dropdown with an add-new control.
- Prevalence — US population base, AD prevalence rate, growth method
- Subpopulation — adult and pediatric segment distribution, current and future
- Diagnosis Rate — adult and pediatric diagnosed fraction with growth rate
- Overall Treatment Rate — treated fraction across the diagnosed population
- Payer Mix — commercial, Medicare, Medicaid, cash distribution
- Site of Care Mix — outpatient vs retail channel split
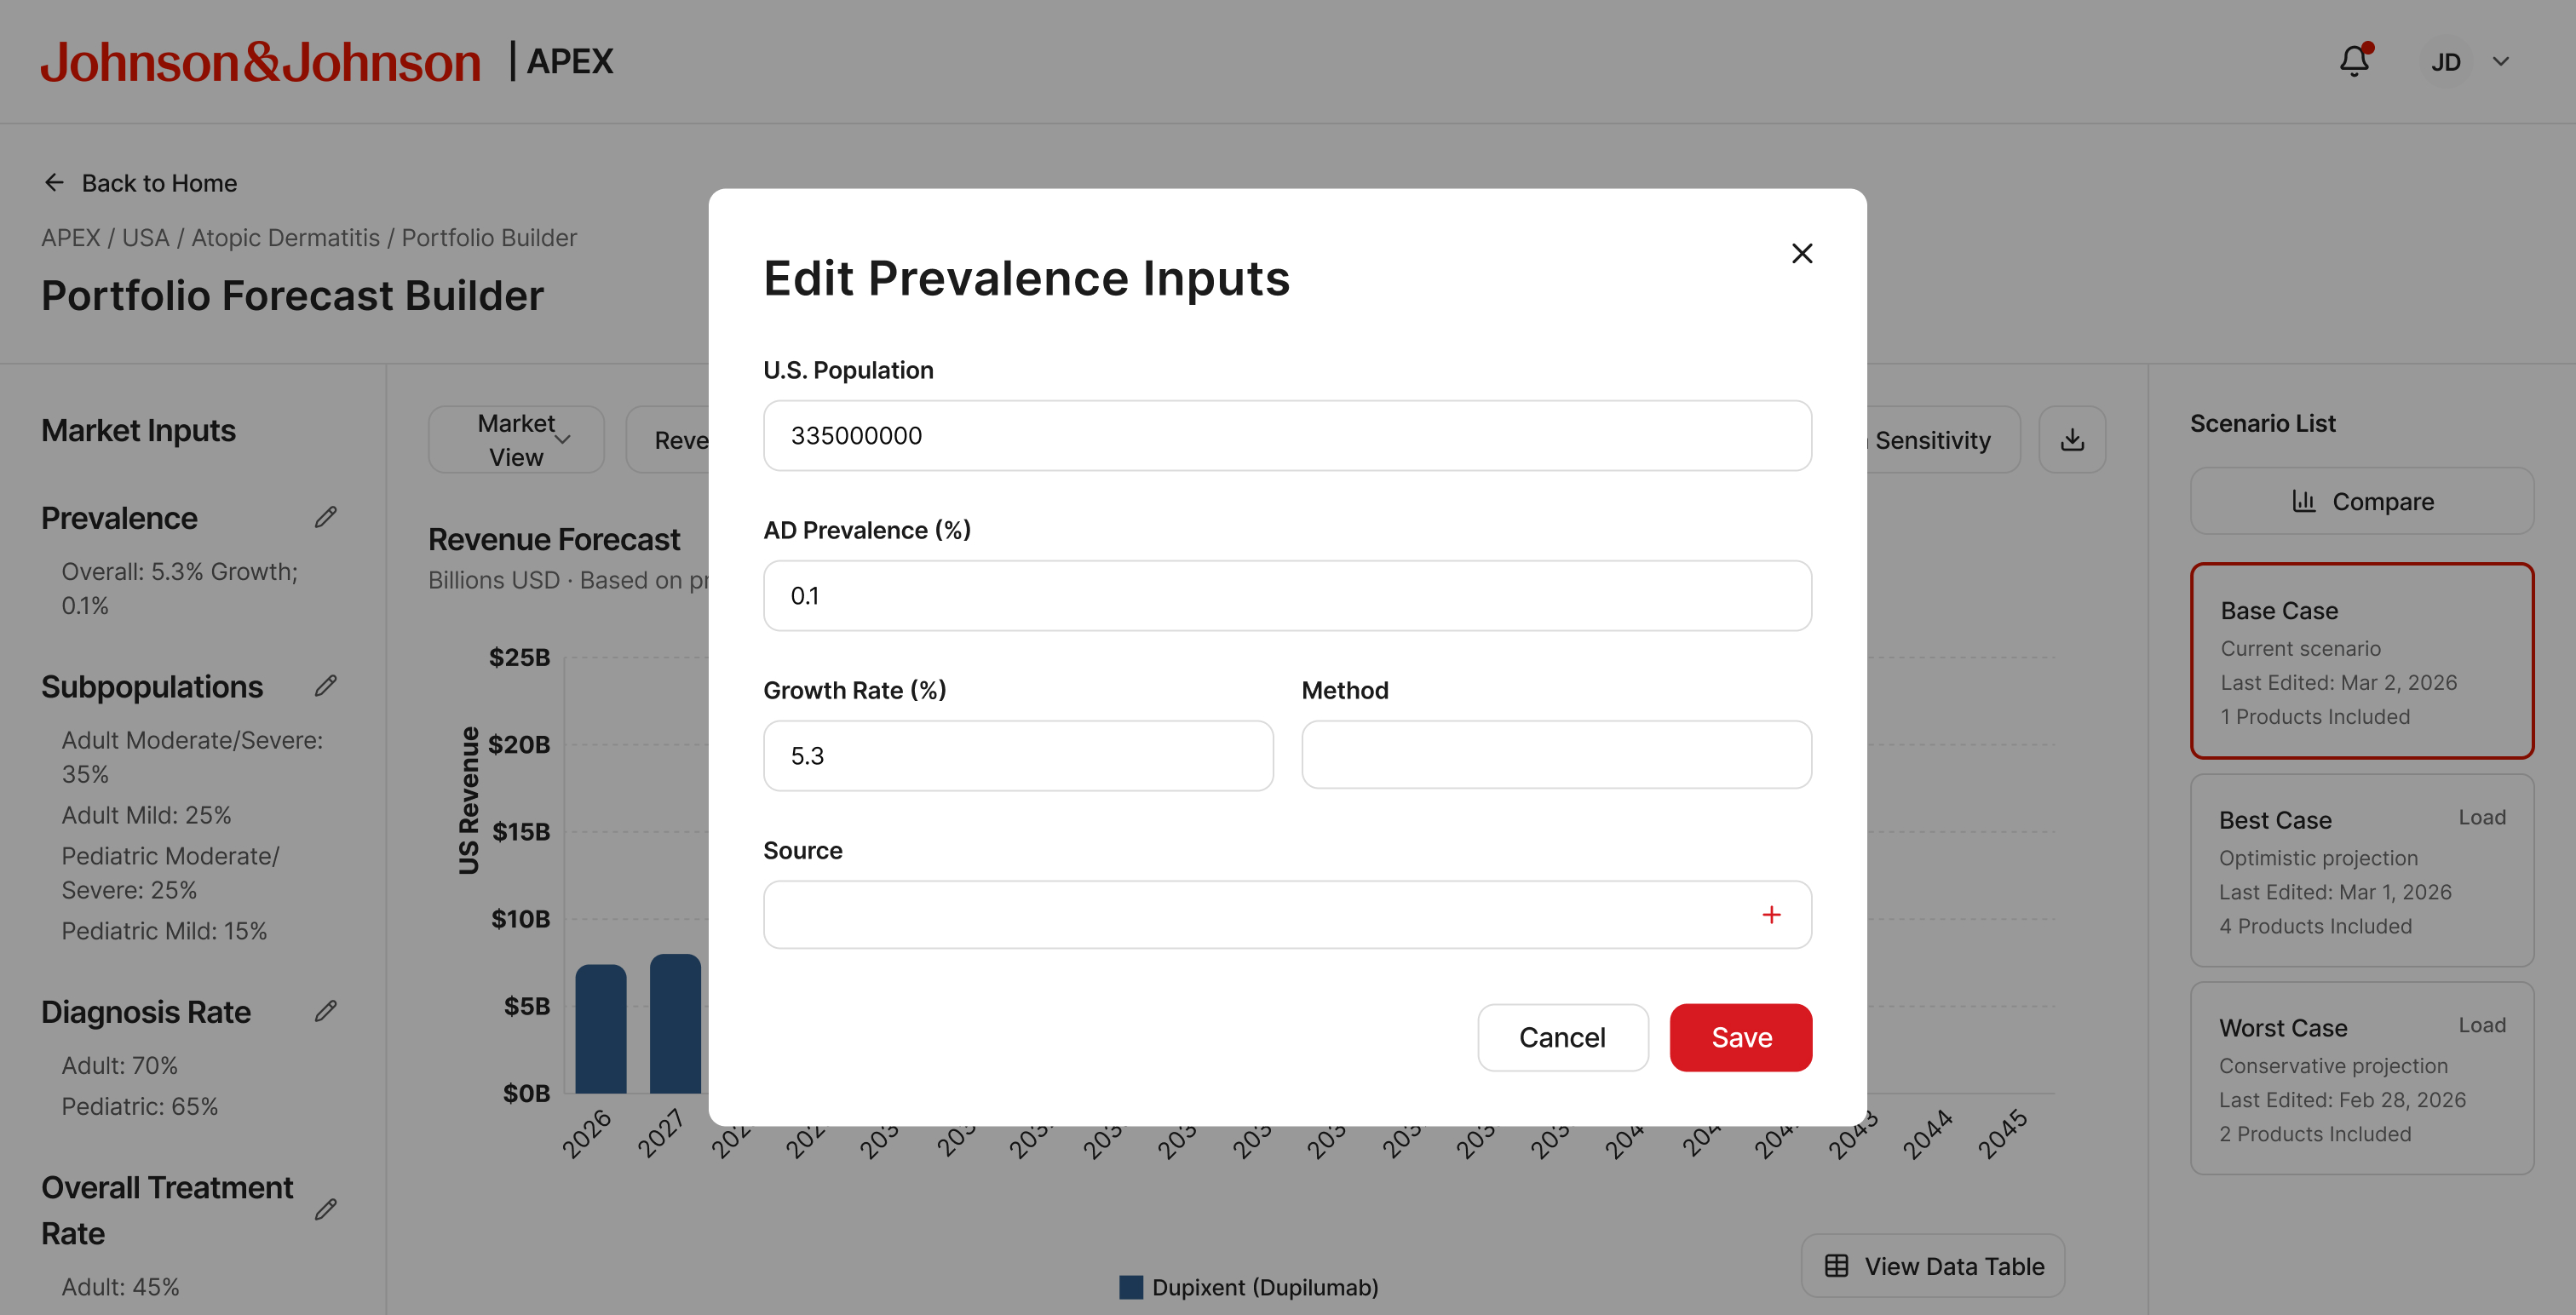
Edit Prevalence — population base, rate, growth method
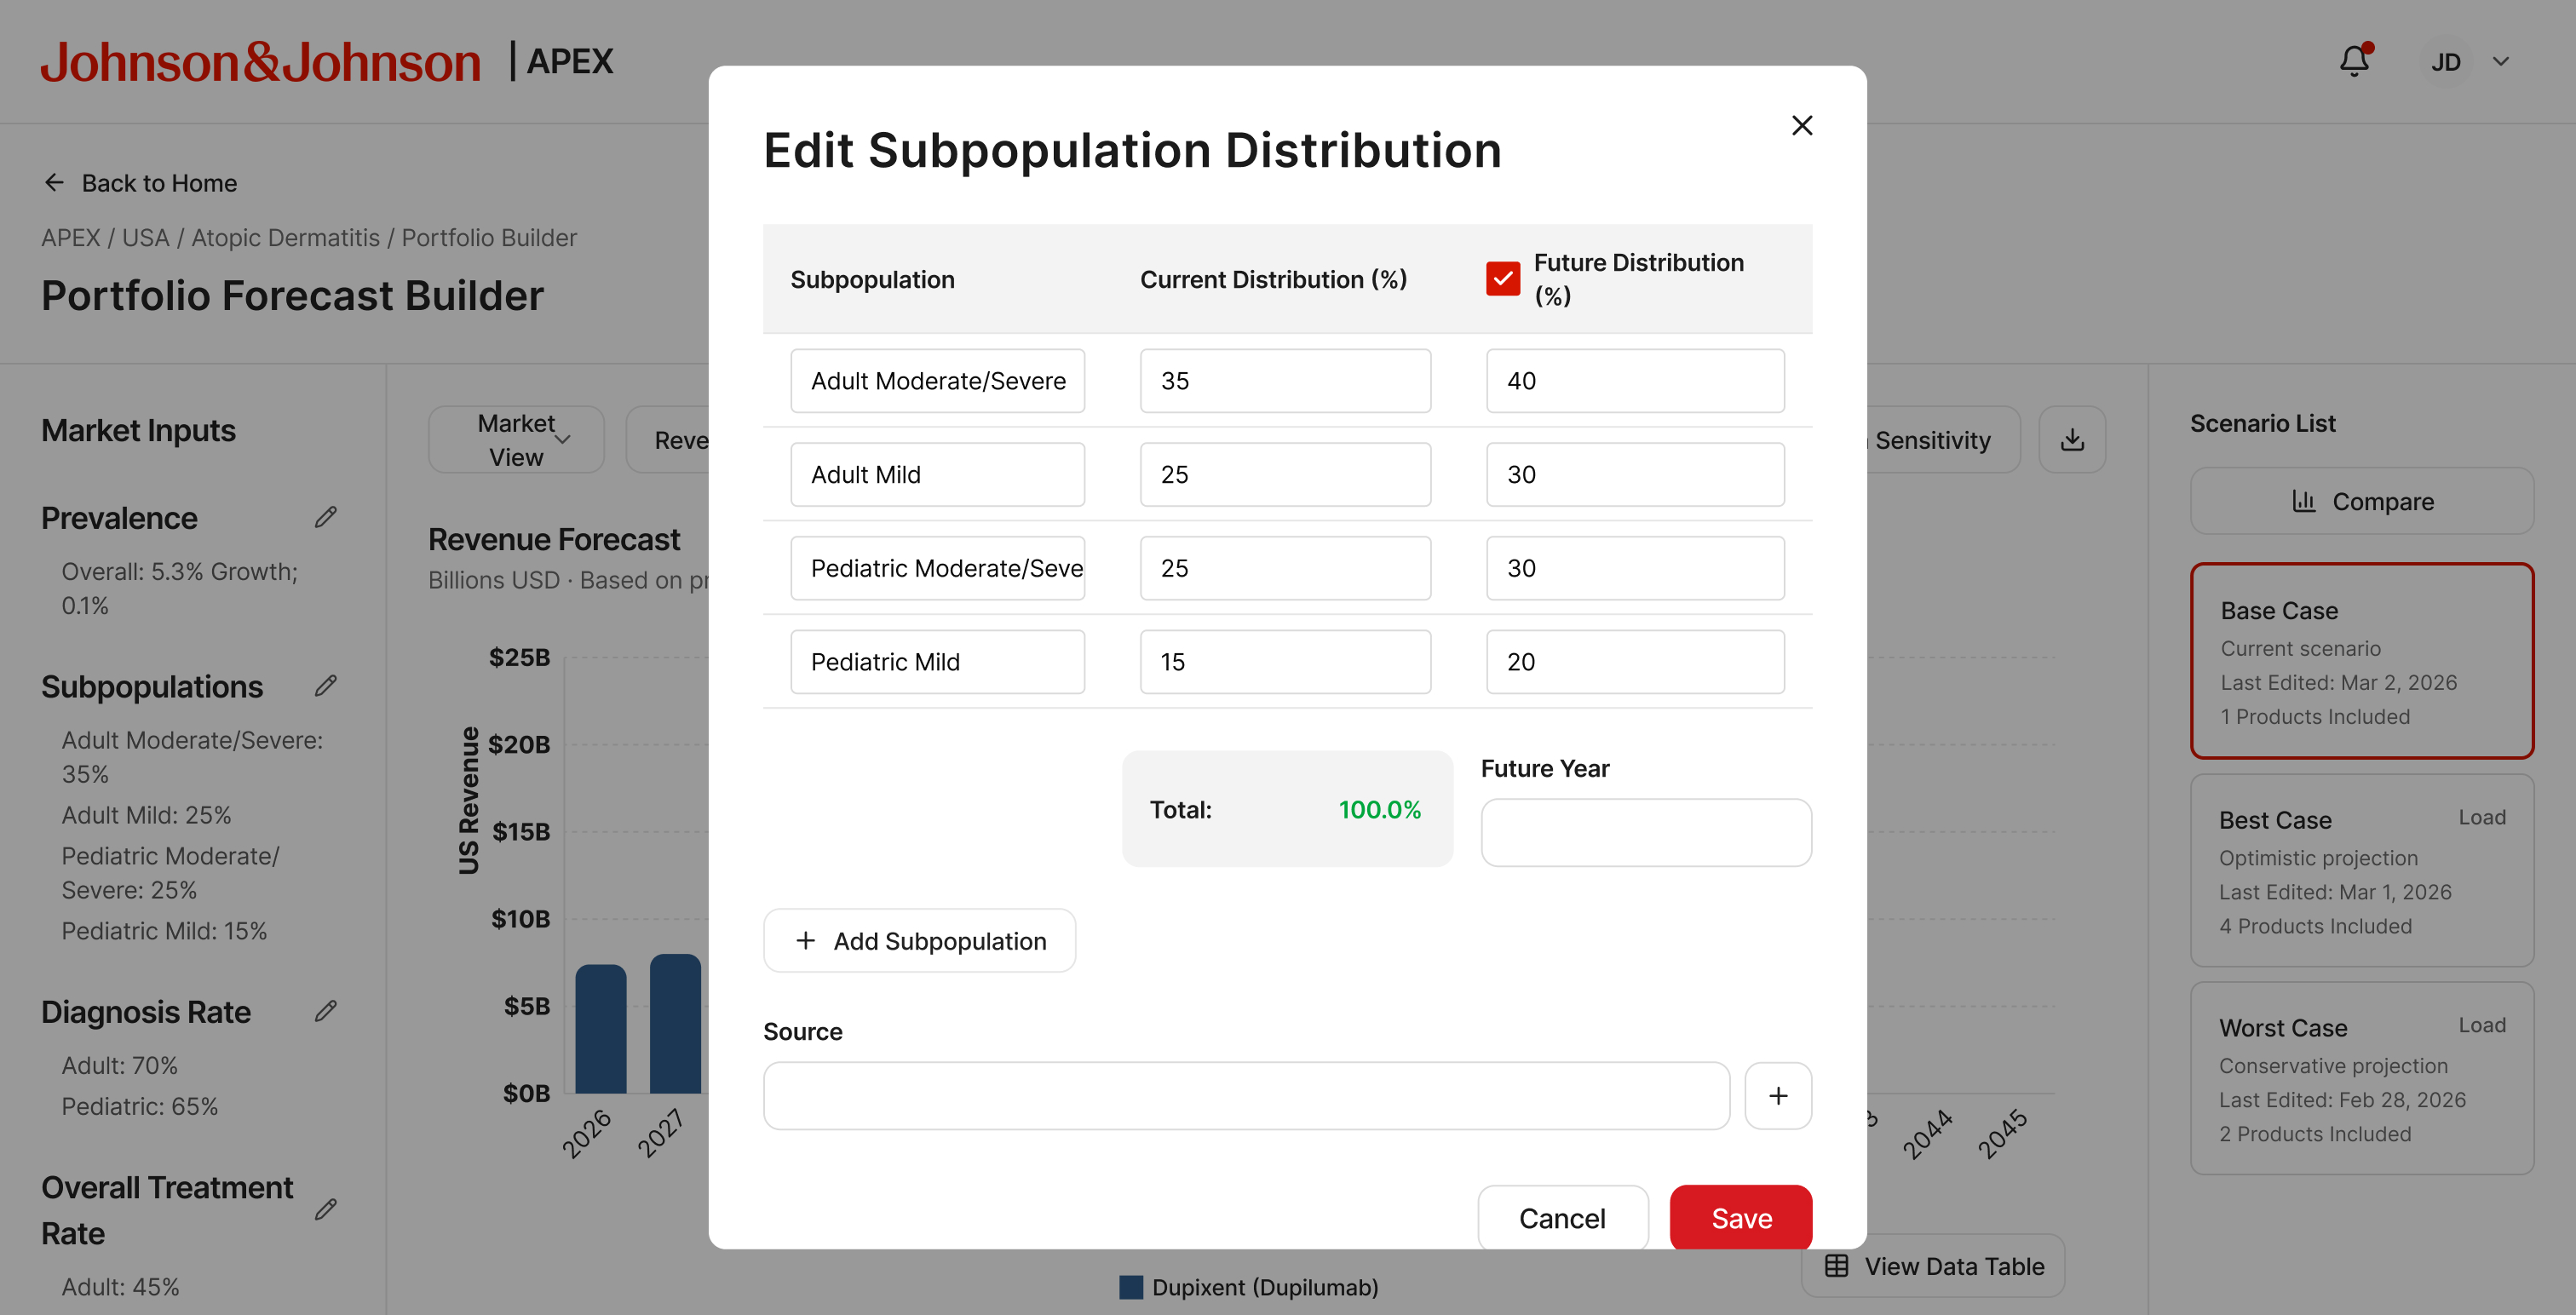
Edit Subpopulation — current and future distribution
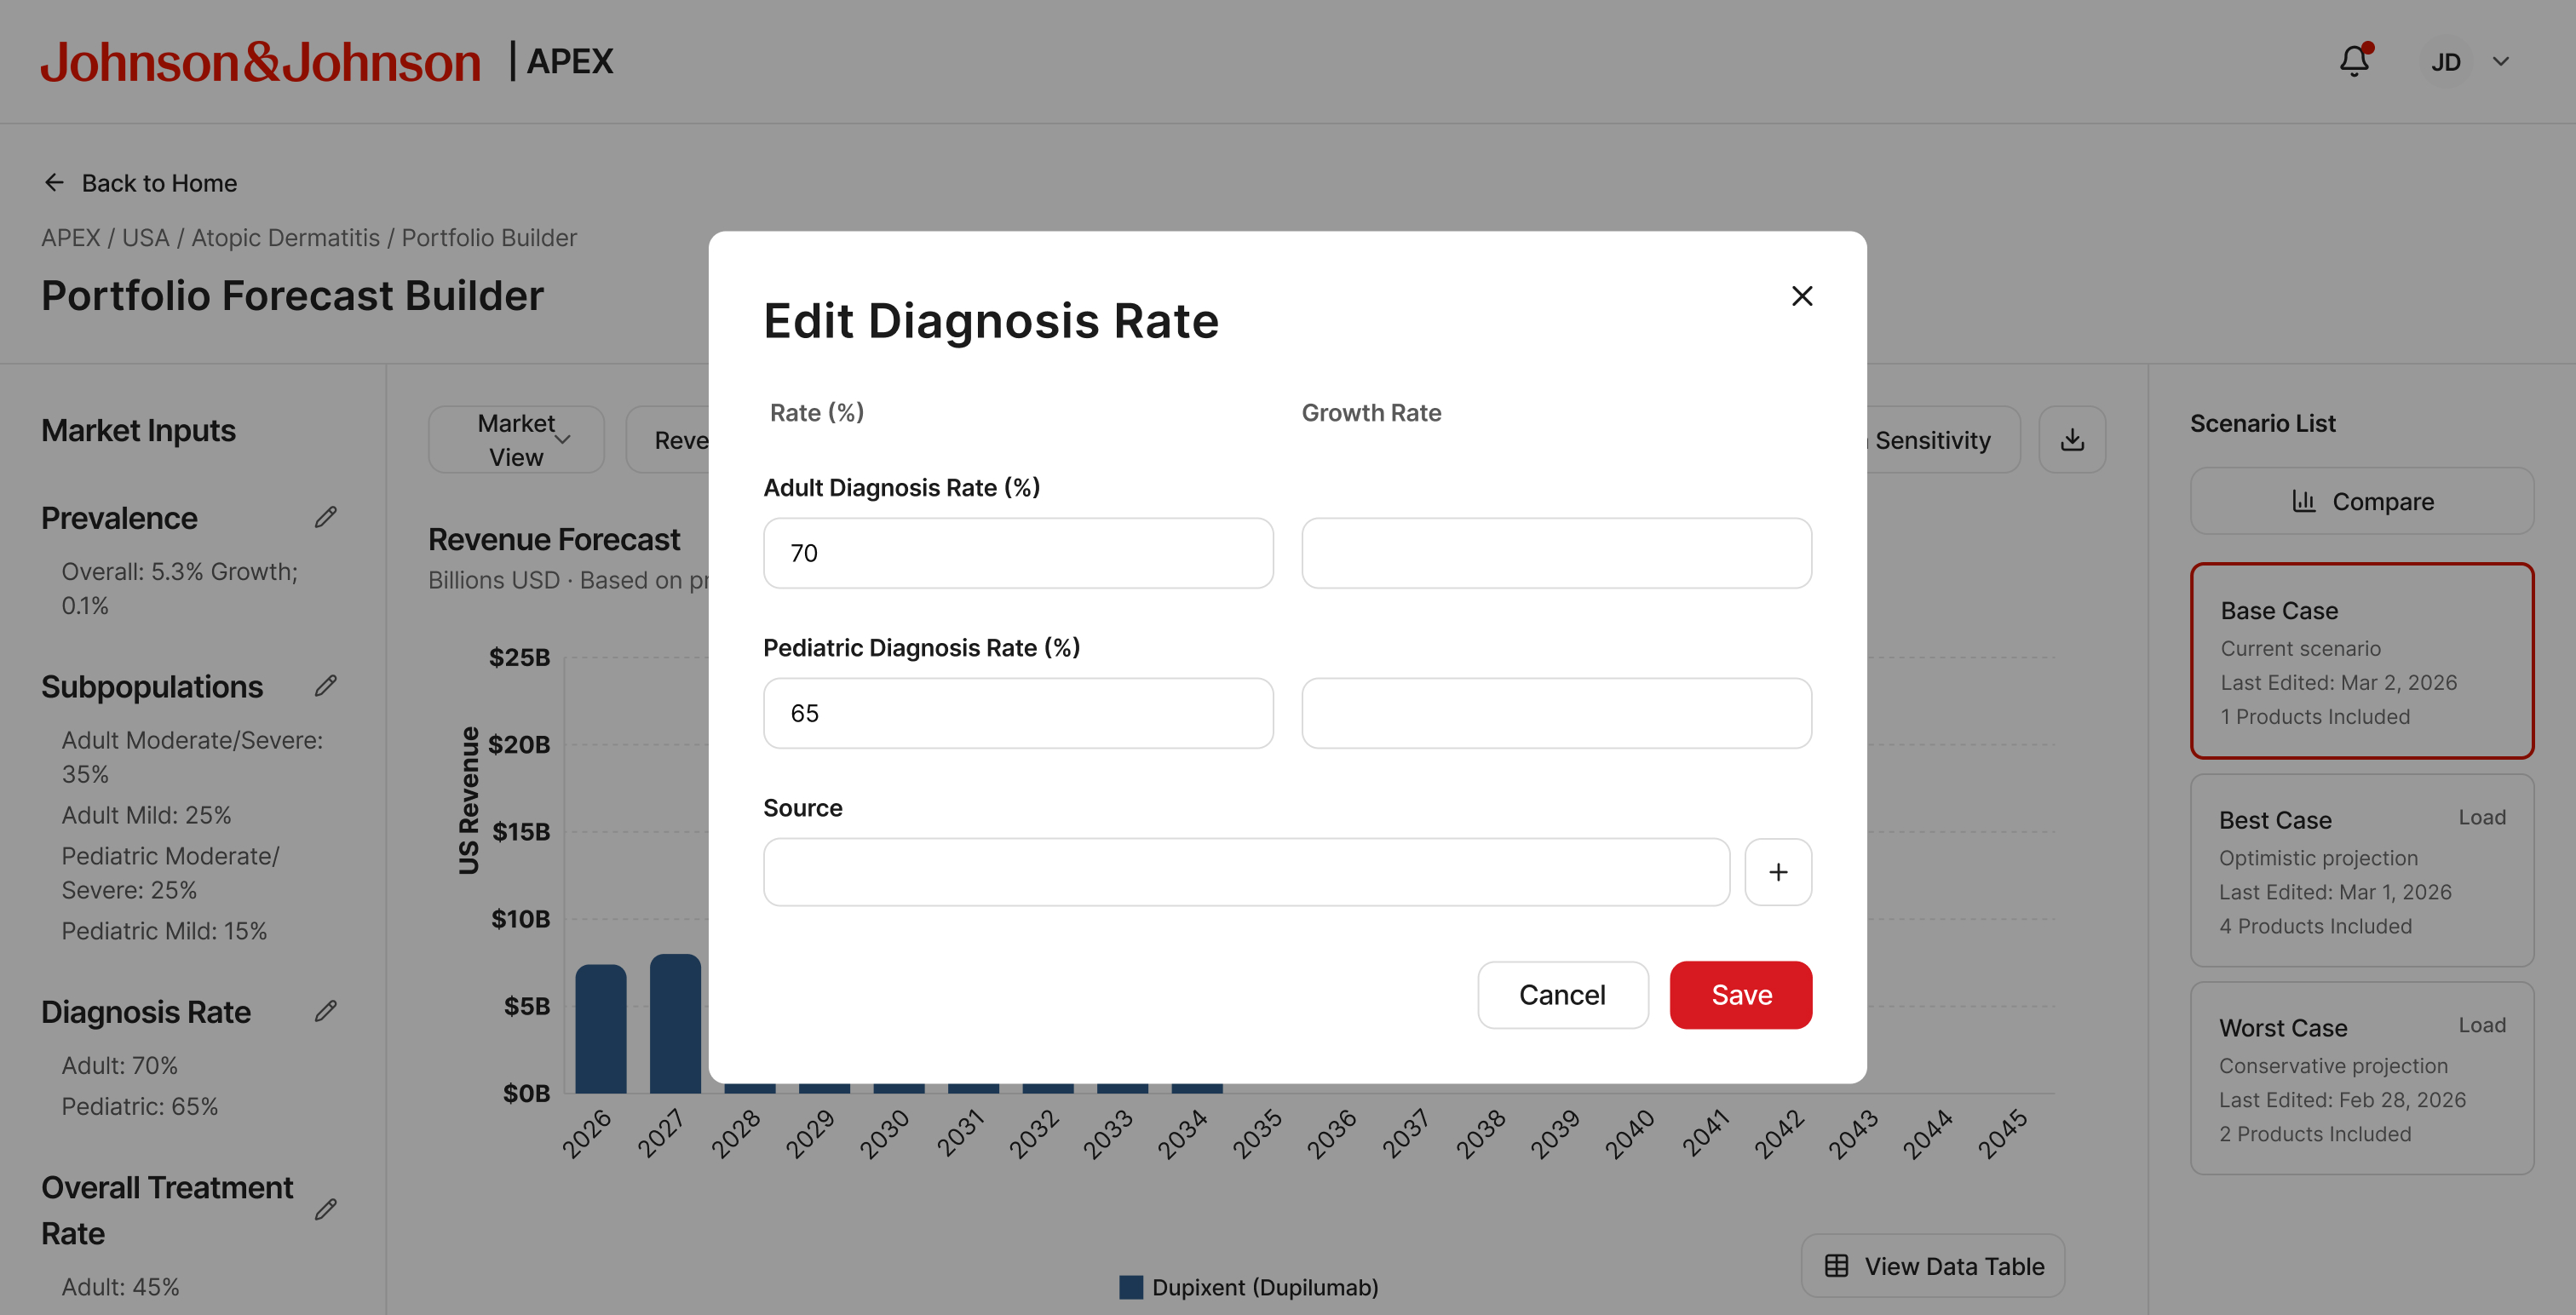
Edit Diagnosis Rate — adult and pediatric rates
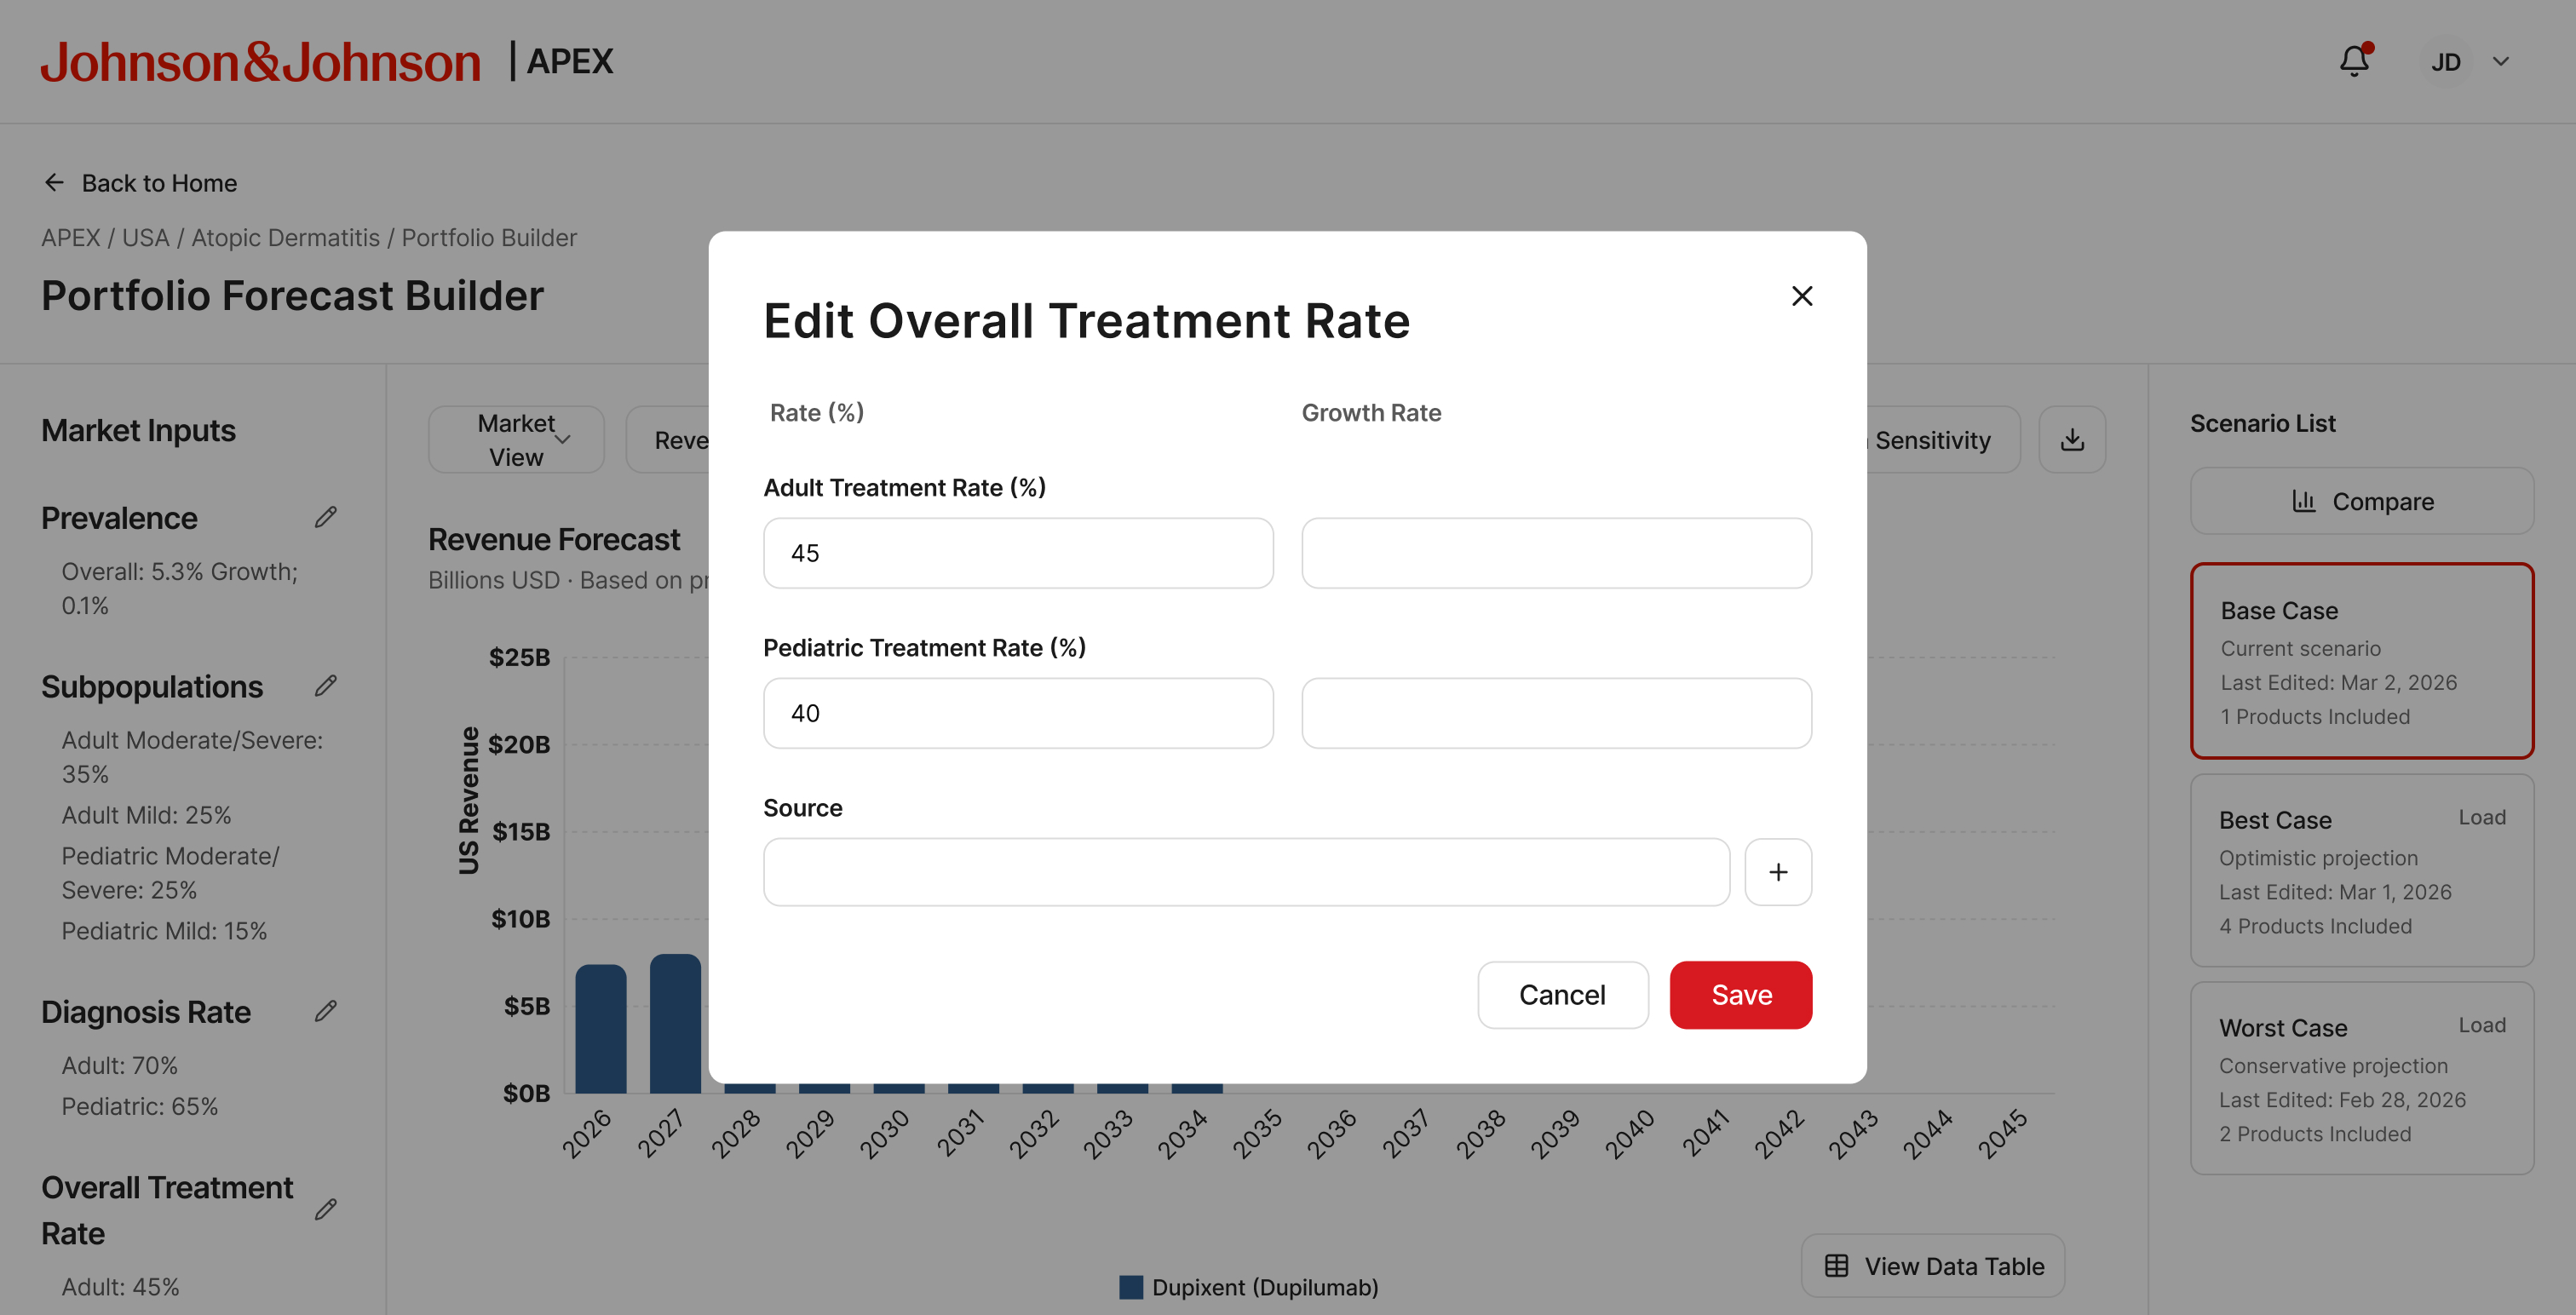
Edit Overall Treatment Rate
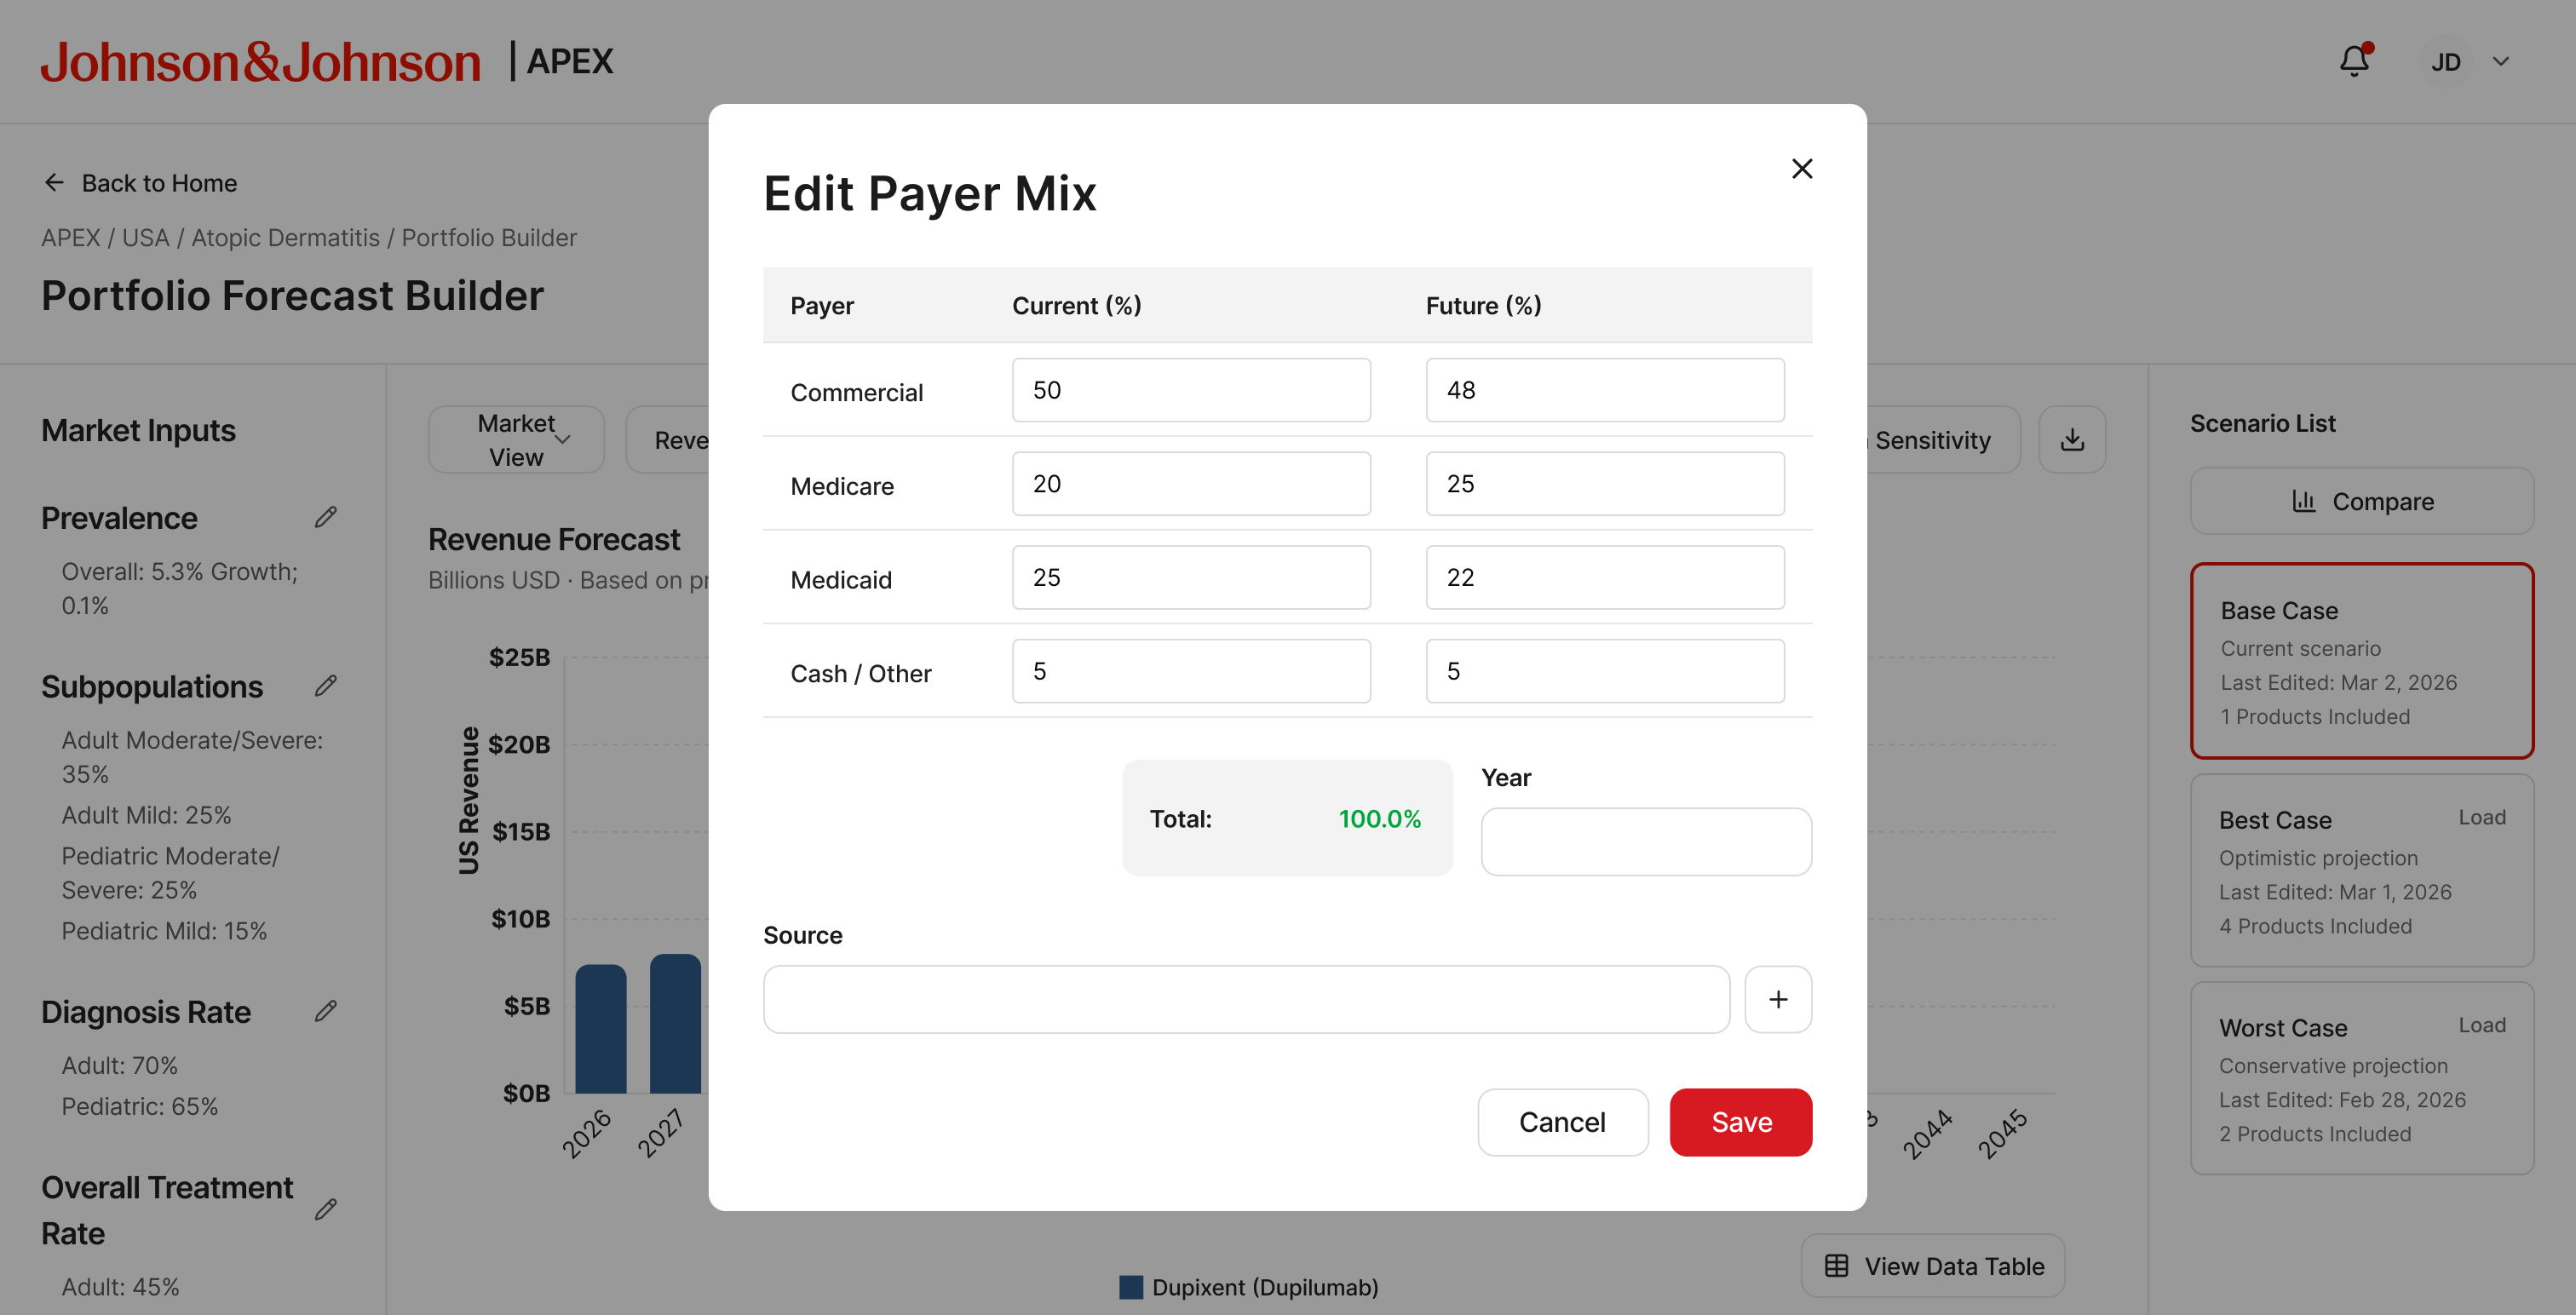
Edit Payer Mix — current and future channel split
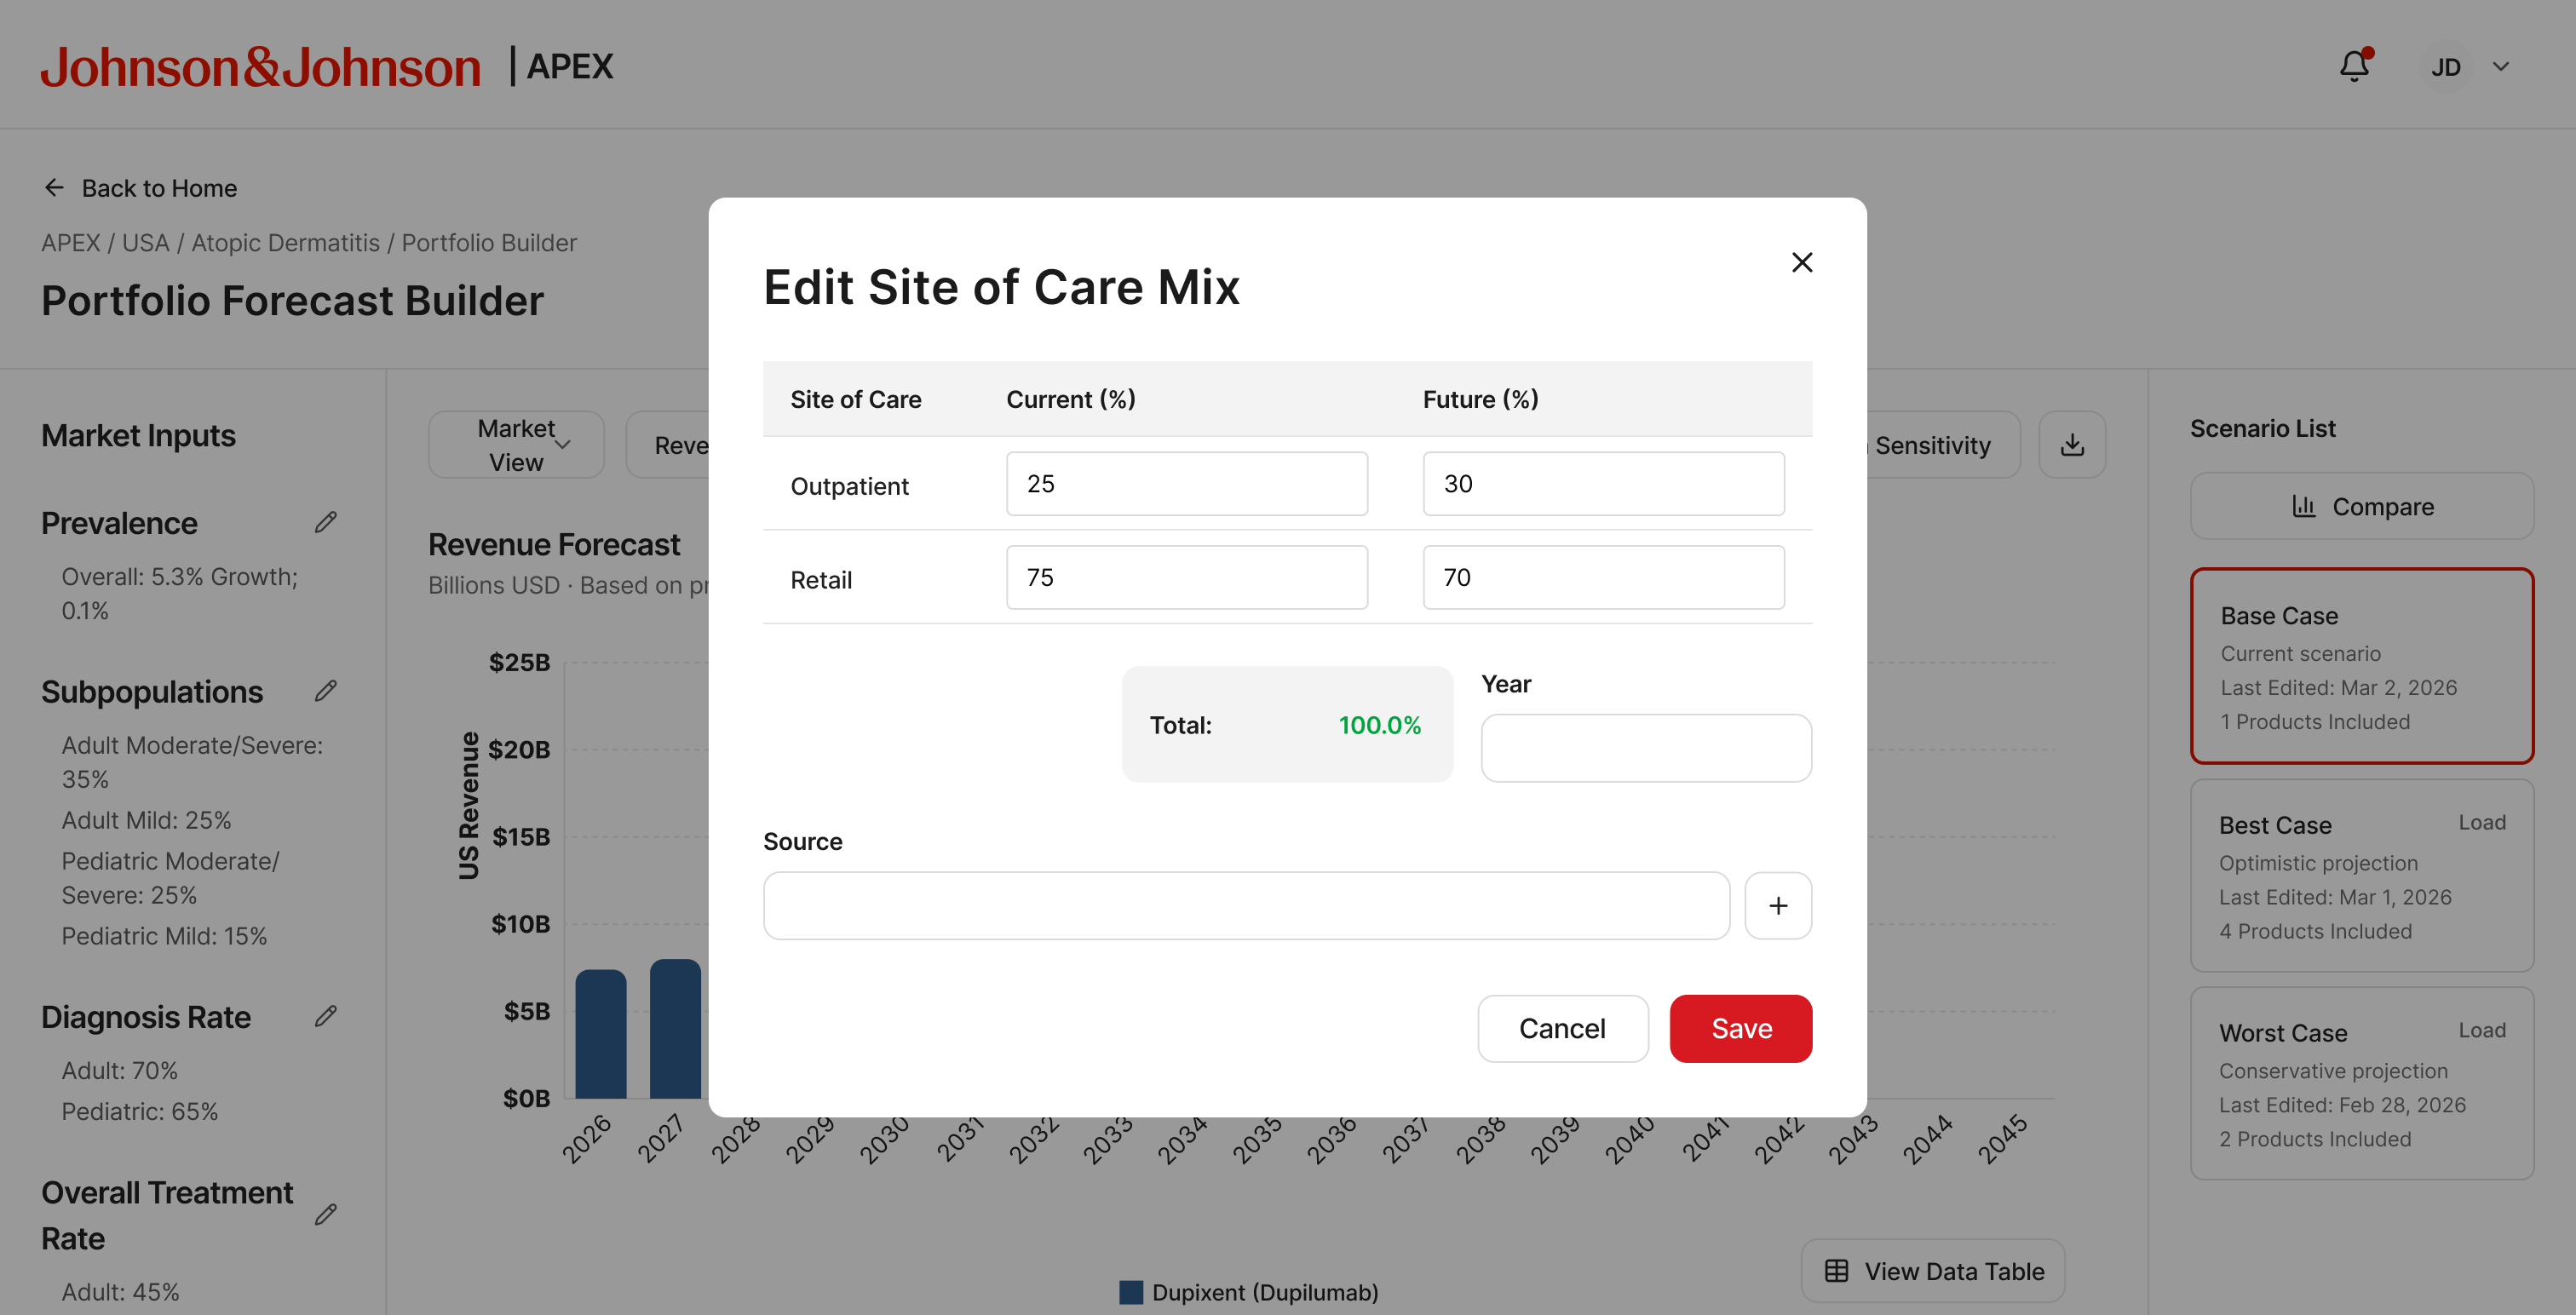
Edit Site of Care Mix
Forecast Engine
Three levels of configuration
The engine selector exposes three method tiers. The progression was deliberate: keep the MVP approachable for the initial expert user group while giving the roadmap a clear path toward more advanced modeling.
- Standard — deterministic calculation with user-provided values. Familiar to anyone who built a forecast in Excel
- APEX Algorithm — a proprietary algorithm pack for more sophisticated scenario modeling
- Custom Configuration — granular, line-item method selection per forecast input
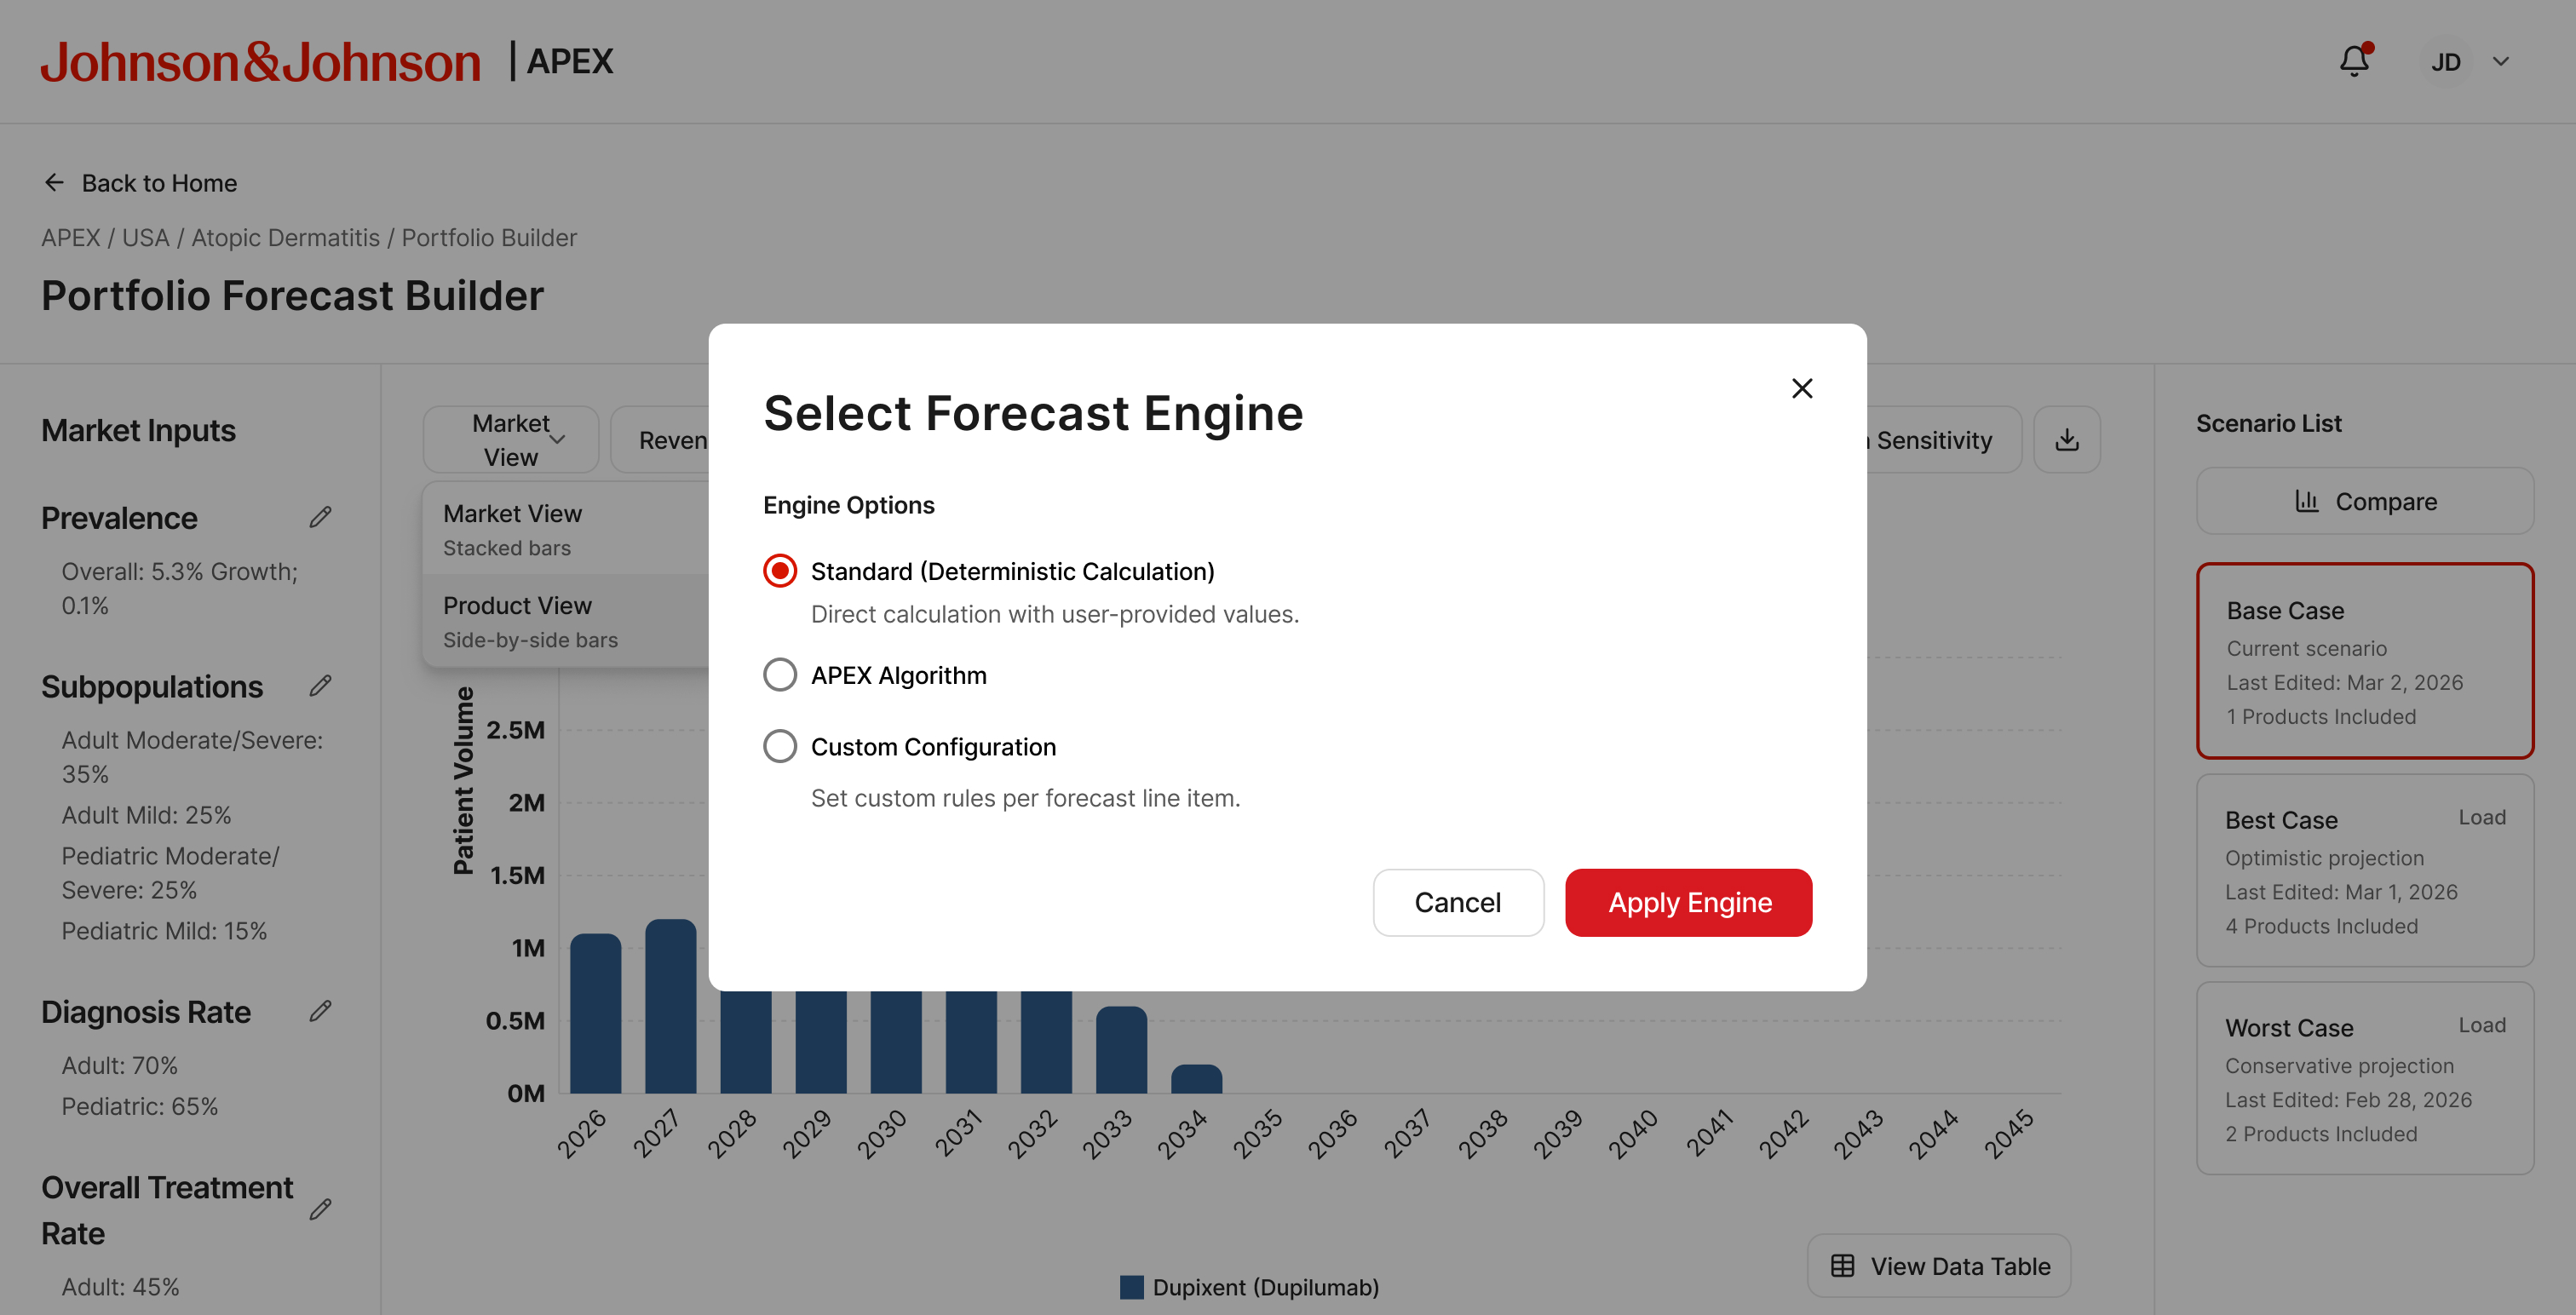
Standard — deterministic, direct calculation
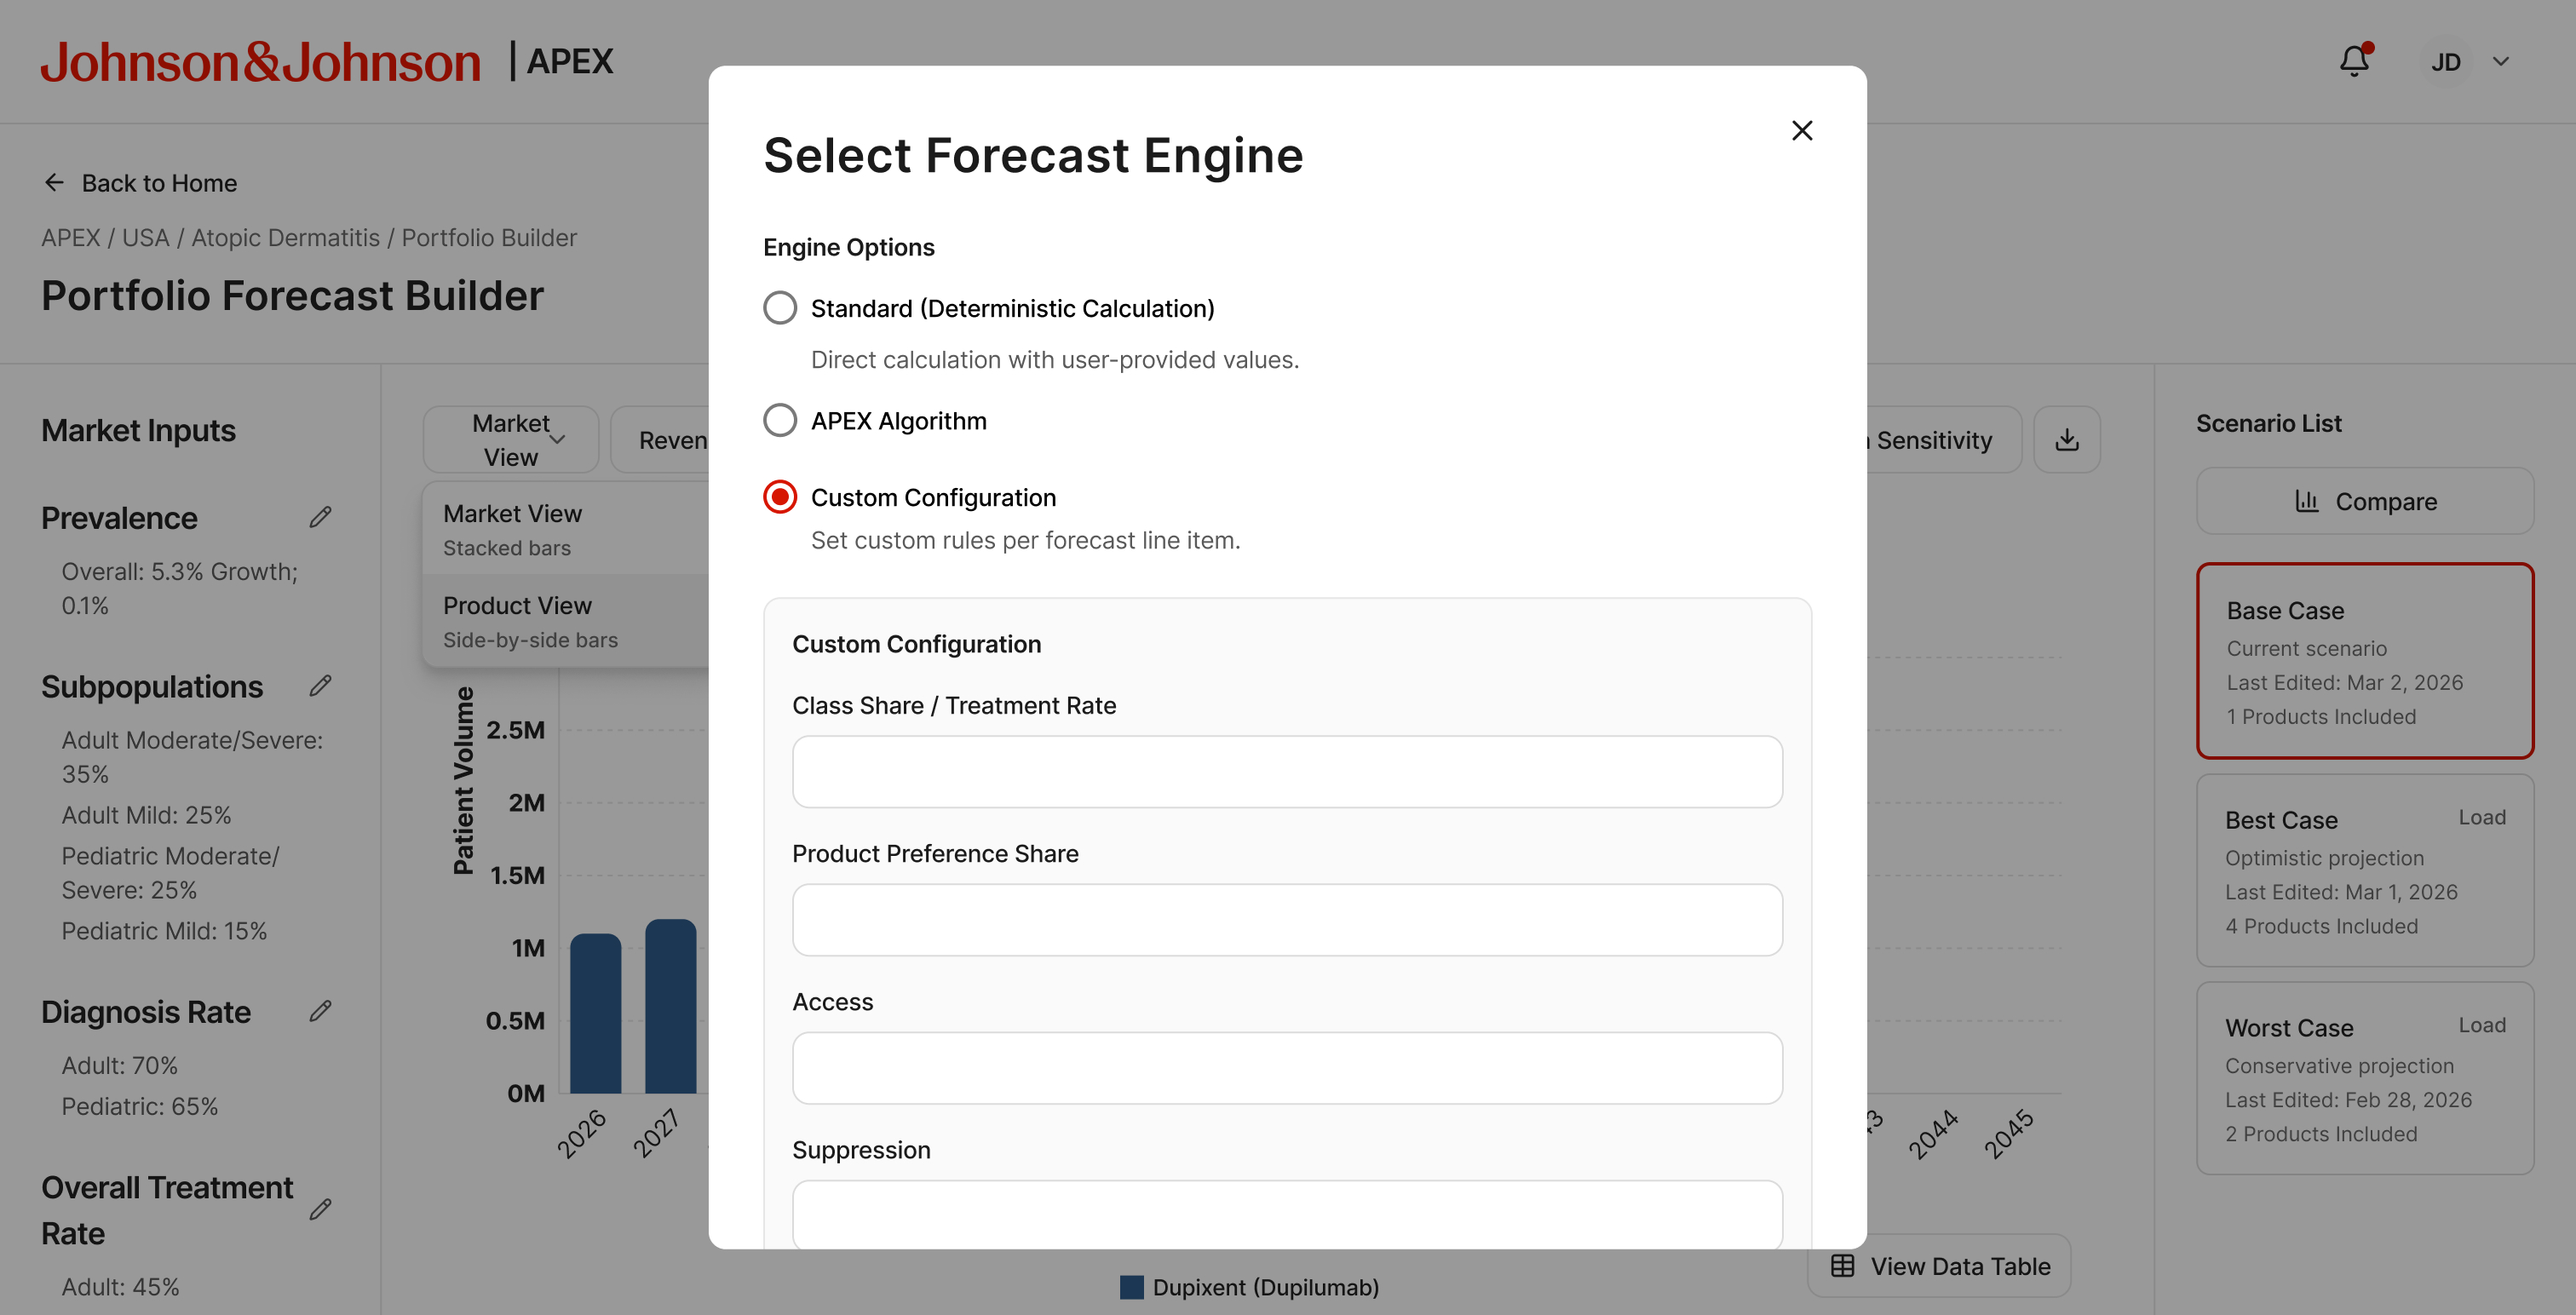
Custom Configuration — per-line-item method selection
Overlay tools
Four modular overlays extend the builder without leaving the main view. Each opens over the active scenario, uses its data as input, and closes back to the same builder state.
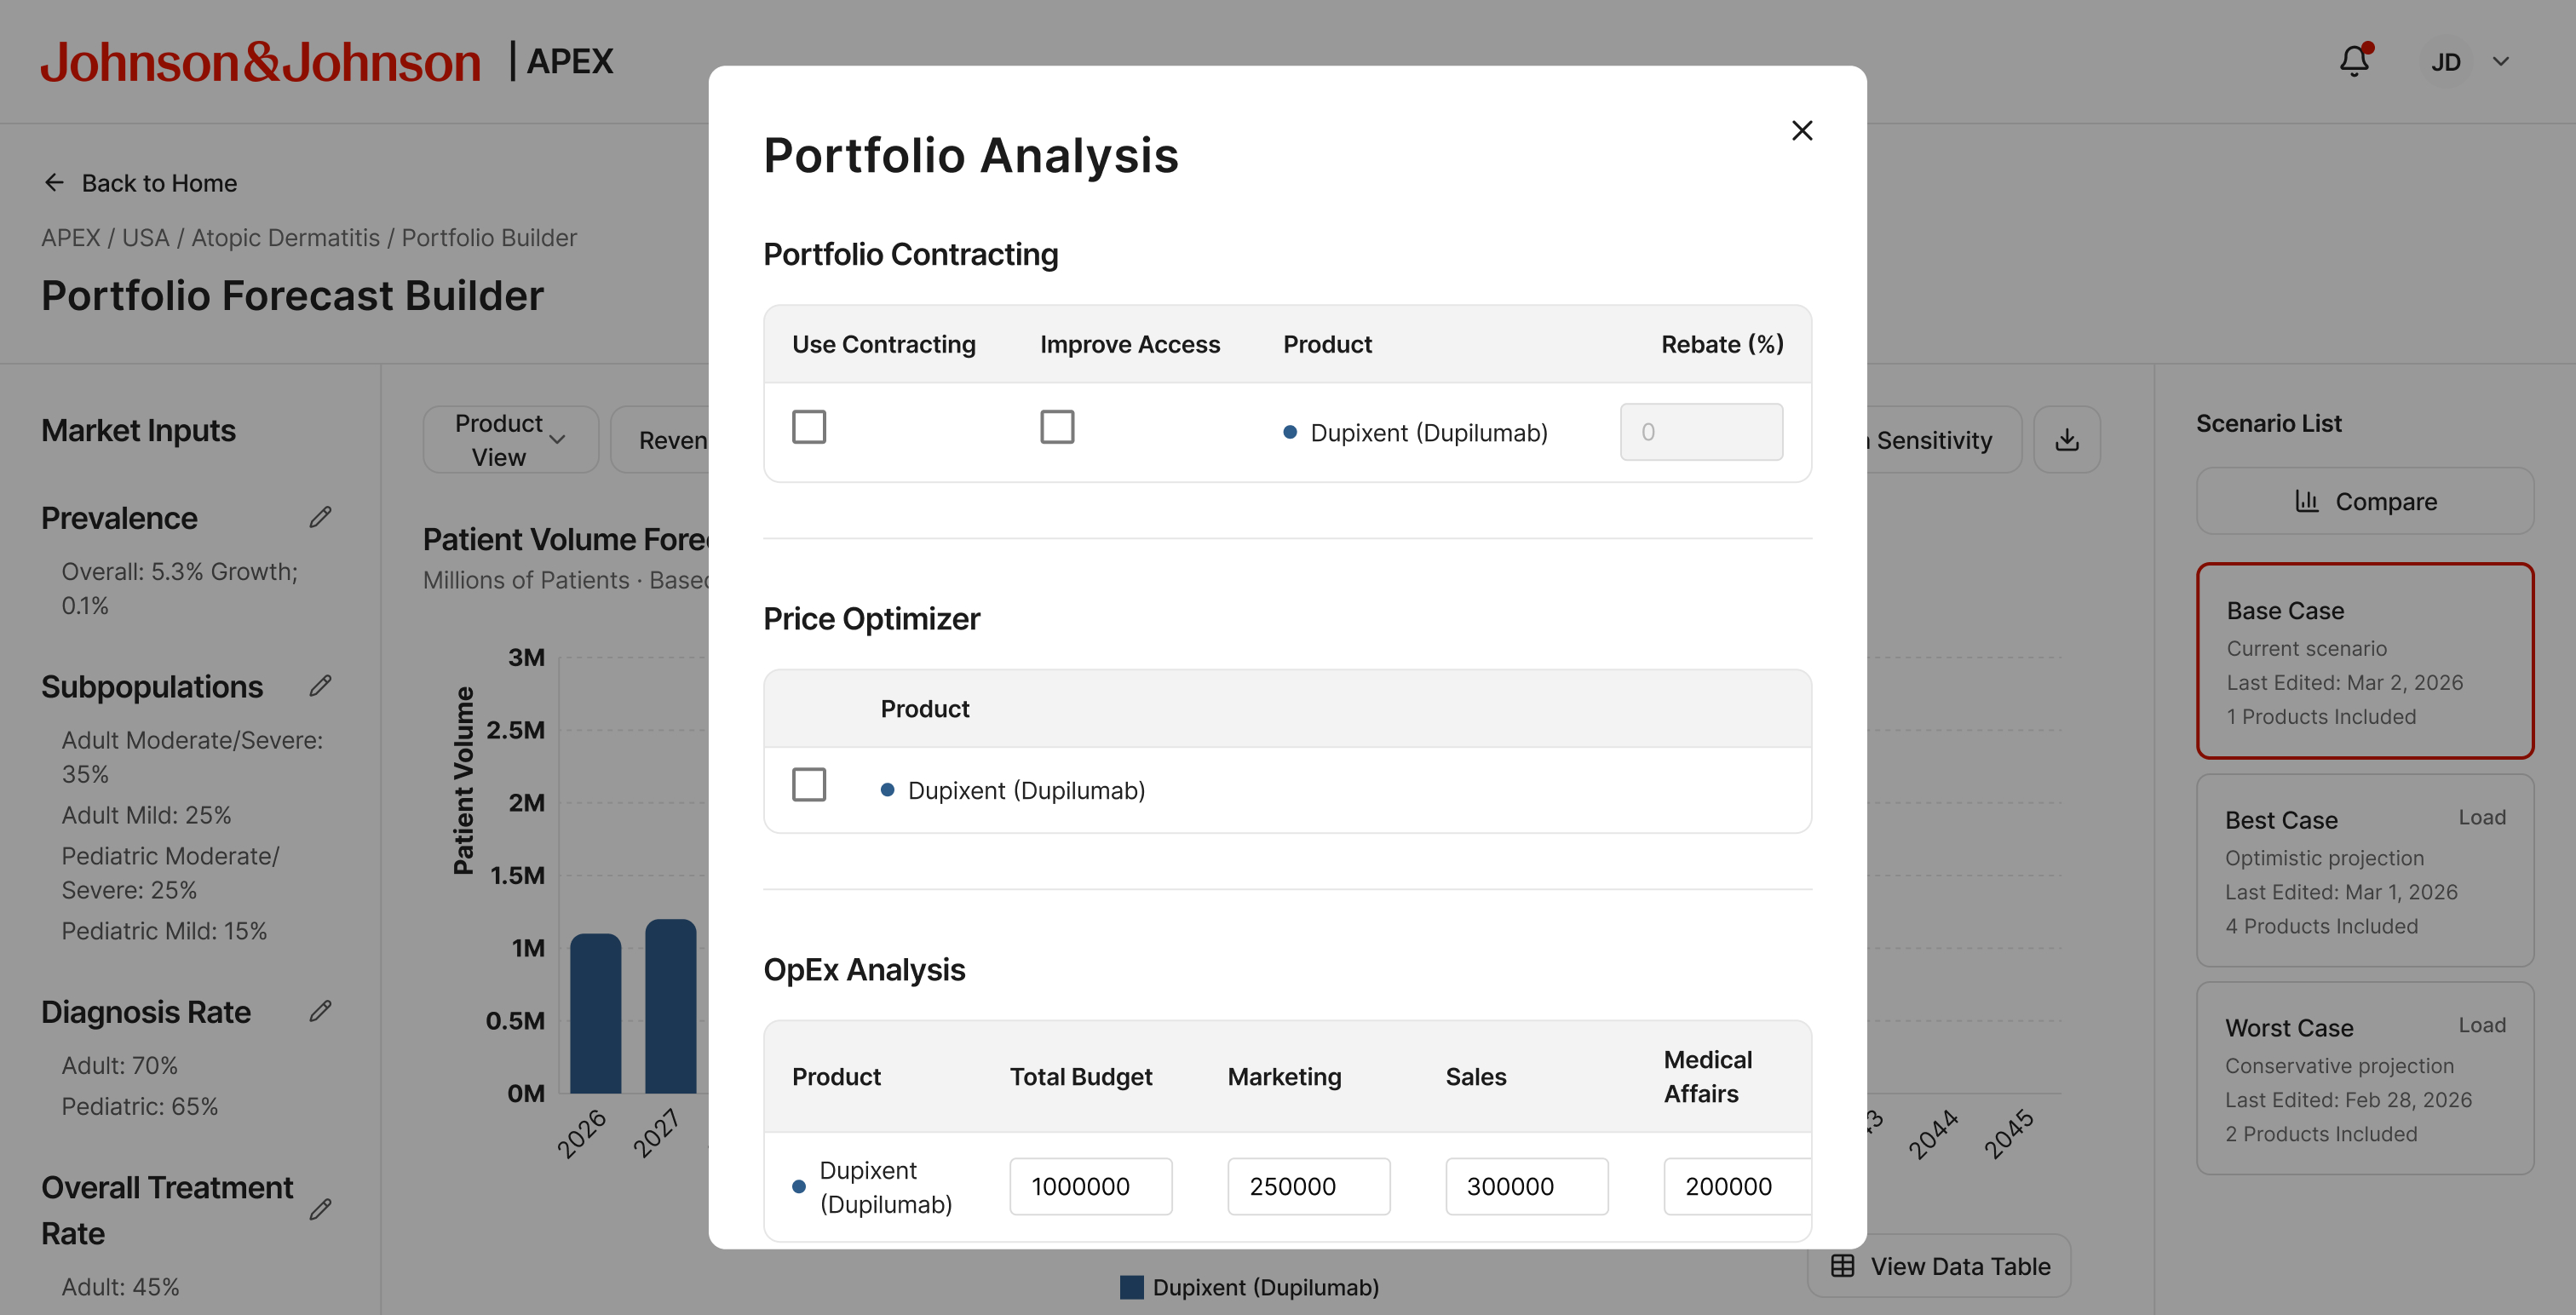
Portfolio Analysis — contracting, price optimizer, OpEx
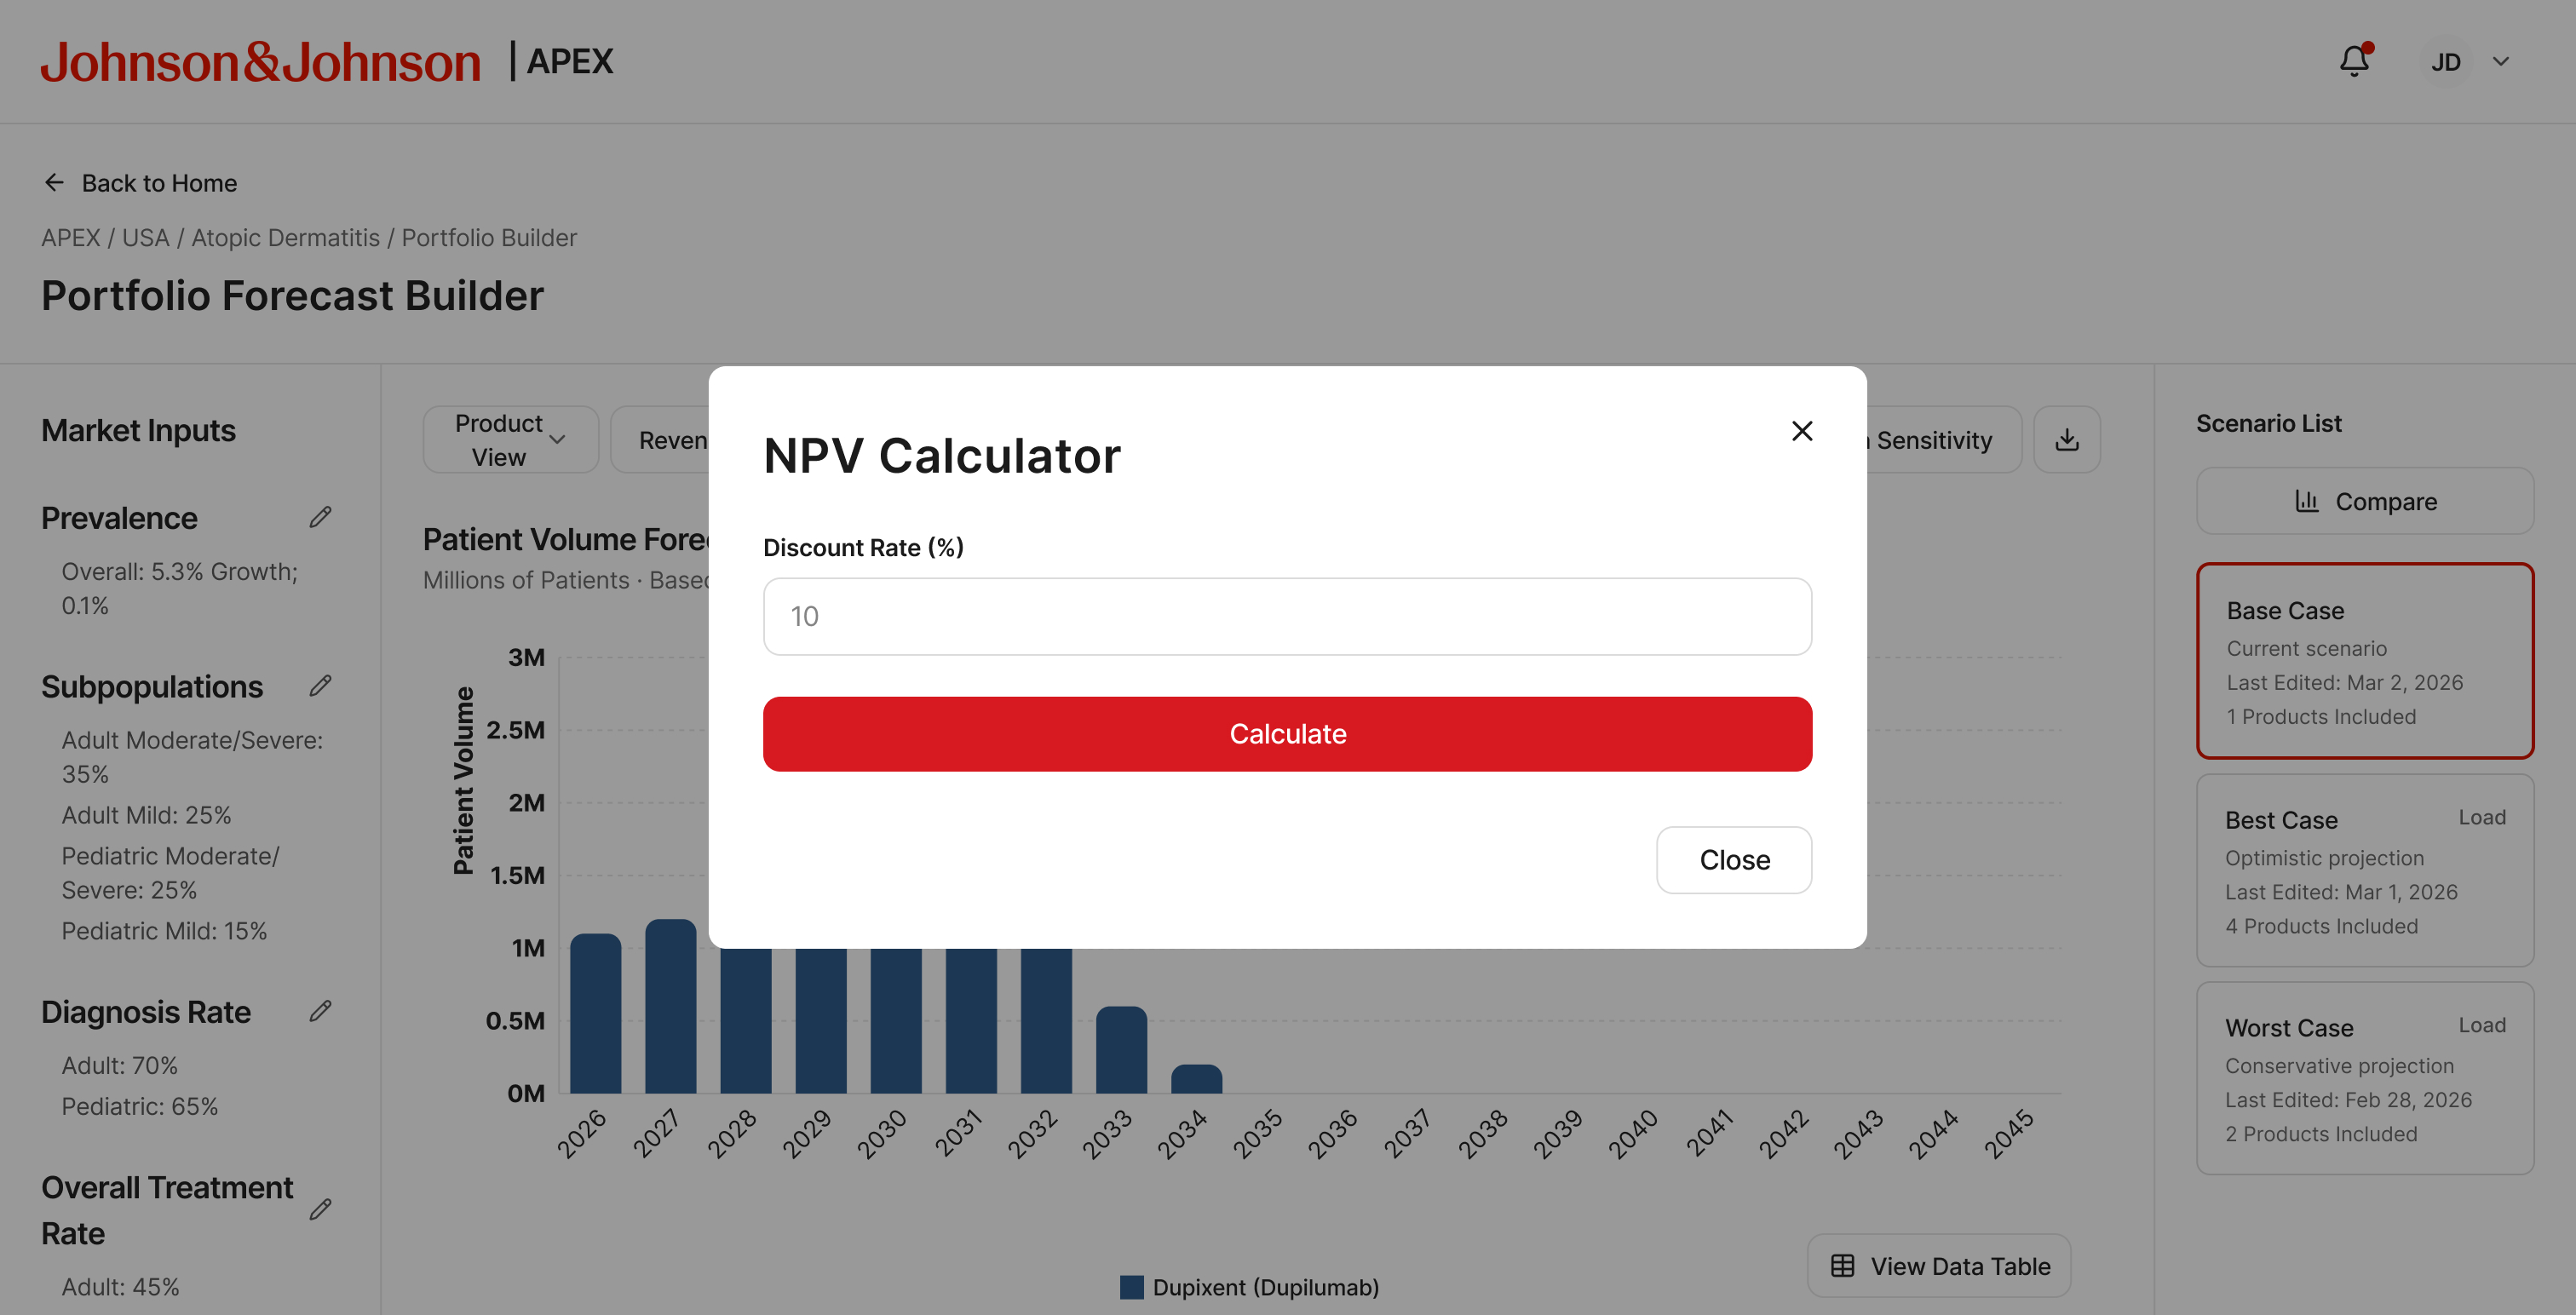
NPV Calculator
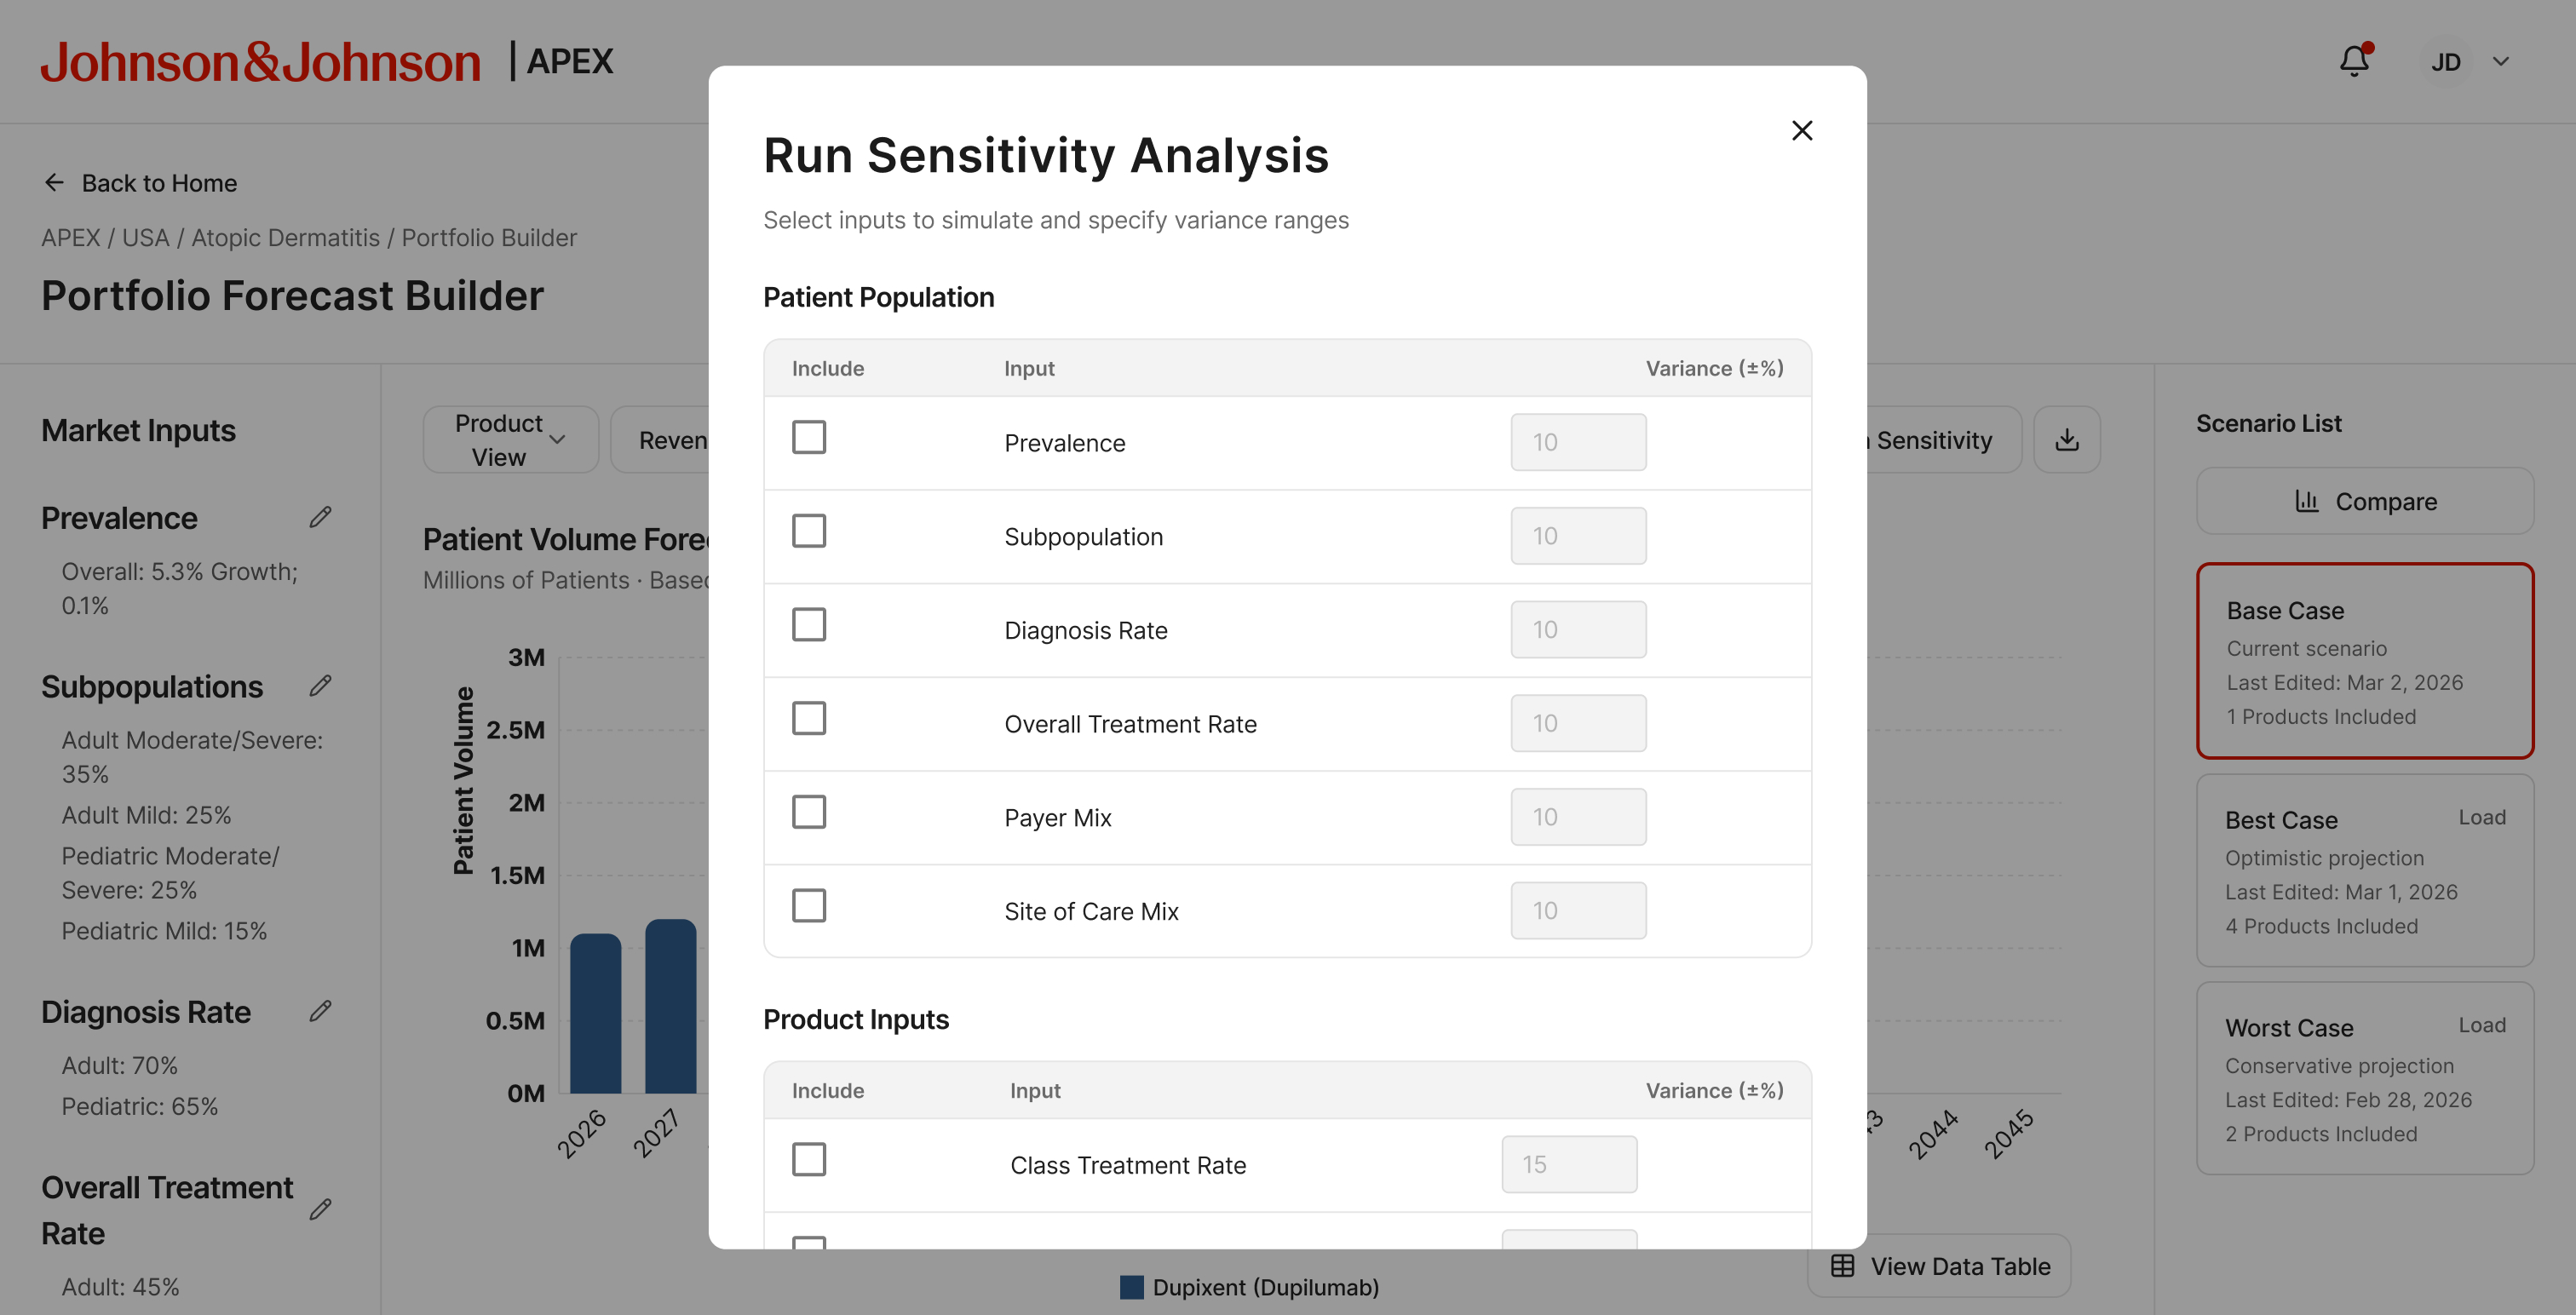
Sensitivity Analysis — variance ranges per input
Governance
Reproducibility built in, not bolted on
Scenarios in APEX are versioned artifacts. A methodology change doesn't erase a prior snapshot.
- Each scenario references the baseline it was built from, the engine version, and the assumption set at creation
- Sandbox-first collaboration — work privately, publish when ready, control what others can modify
- Audit trail tracks who changed what, and when
Governance wasn't a reporting layer added later. It was the precondition for the tool being trusted in a portfolio planning cycle.
WhatIdesigned
- End-to-end pharma forecasting prototype from RFP brief to executive pitch — no devs, fast iteration with partners, directors, and PM
- Scenario library as the central organizing structure — each forecast a named, versioned artifact
- Six market input modals with current/future structure and source-linked assumption fields
- Three-tier forecast engine: Standard, APEX Algorithm, and Custom Configuration
- Market Map covering prevalence, subpopulation, payer mix, and competitive treatment rates
- Four modular overlay tools: Portfolio Analysis, NPV, Sensitivity, and Export
- Governance system with versioned snapshots, sandbox vs shared workspace, and publishing controls
- Rebranded and refined for executive stakeholder review as APEX
Reflection
Designing for experts who know exactly what they need
Forecasting analysts and pharma strategy leads have strong opinions about their tools. Any interface that adds steps, hides assumptions, or obscures the logic gets rejected fast.
That constraint pushed the design in one direction: transparency. Show the assumptions. Make them editable. Version everything. The goal wasn't to simplify pharmaceutical forecasting. It was to make the workflow fast enough to run during a strategy session, auditable enough to survive a methodology review, and structured enough to grow beyond Atopic Dermatitis into the broader J&J portfolio.