
Interactive Utilization Calculator — Guidehouse
Replaced Guidehouse's Excel-based utilization calculator with an enterprise planning platform: live data, scenario forecasting, private drafts, and AI-assisted planning for client-service employees across the US and Canada.
Guidehouse: AI Transformation Management Office – HR · 2026
The Conditions
One of the firm's most important metrics was being planned in a spreadsheet.
Utilization drives staffing decisions, financial forecasting, project planning, and employee performance conversations. Before this initiative, employees planned it in large Excel workbooks: manual calculations, repetitive data entry, and numbers pulled by hand from multiple internal systems.
The workbook was difficult to maintain, difficult to understand, and prone to errors. And the people using it were not finance people. They were consultants trying to answer one question: am I on track?
“The product needed to be a planning tool, not a system of record. My Metrics stays the source of truth for official reporting. That boundary shaped almost every design decision that followed.”
- Role
- Senior UX Designer: UX strategy, product design, IA, AI experience, accessibility, design QA
- Scope
- Forecasting platform, People Manager views, AI assistant, admin console
- Team
- Product Management, Finance, Engineering, AI Transformation Management Office, QA, Change Management
- Integrations
- Workday, Enterprise Data Warehouse, Power BI (My Metrics), Guidehouse Hub, Guidehouse Apps, Azure OpenAI roadmap
My Role
Product direction, not just screens
I led UX strategy and product design across the full lifecycle: Phase 1, production launch, and Phase 2, partnering with Product Management, Finance, Engineering, AI Transformation Management Office leadership, QA, and Change Management to shape both the product direction and the experience.
- Translated finance rules into an interface consultants could actually use
- Ran design QA through development and validated in production
- Turned usability findings into formal requirements and Jira stories for later releases
- Prioritized features alongside PM and Finance, not downstream of them
What research looked like here
Iterative enterprise research, not a study with a start and end date. Insights came from live UAT sessions, production validation, stakeholder workshops, finance reviews, engineering discussions, written user feedback, Jira enhancement requests, meeting transcripts, and usability reviews. Every release informed the next.
The Hard Part
Three problems, all of them competing
1 · Making complex business rules understandable
The interface represented financial calculations most employees did not understand: utilization targets, protected leave, forecast versus actuals, billable hours, planning math. The challenge was translating those concepts into an experience that made sense without teaching anyone the formulas.
2 · Balancing competing priorities
Every decision balanced business requirements, finance rules, technical limitations, engineering timelines, and user expectations. Many improvements had to be negotiated across teams before they could be built.
3 · Building trust
Employees needed confidence that the numbers were accurate, that forecasts reflected real data, that planning would not affect official reporting, and that managers only ever saw what was intentionally submitted. Transparency became as much of a design requirement as usability.
The Forecast
Answer “am I on track?” above the fold
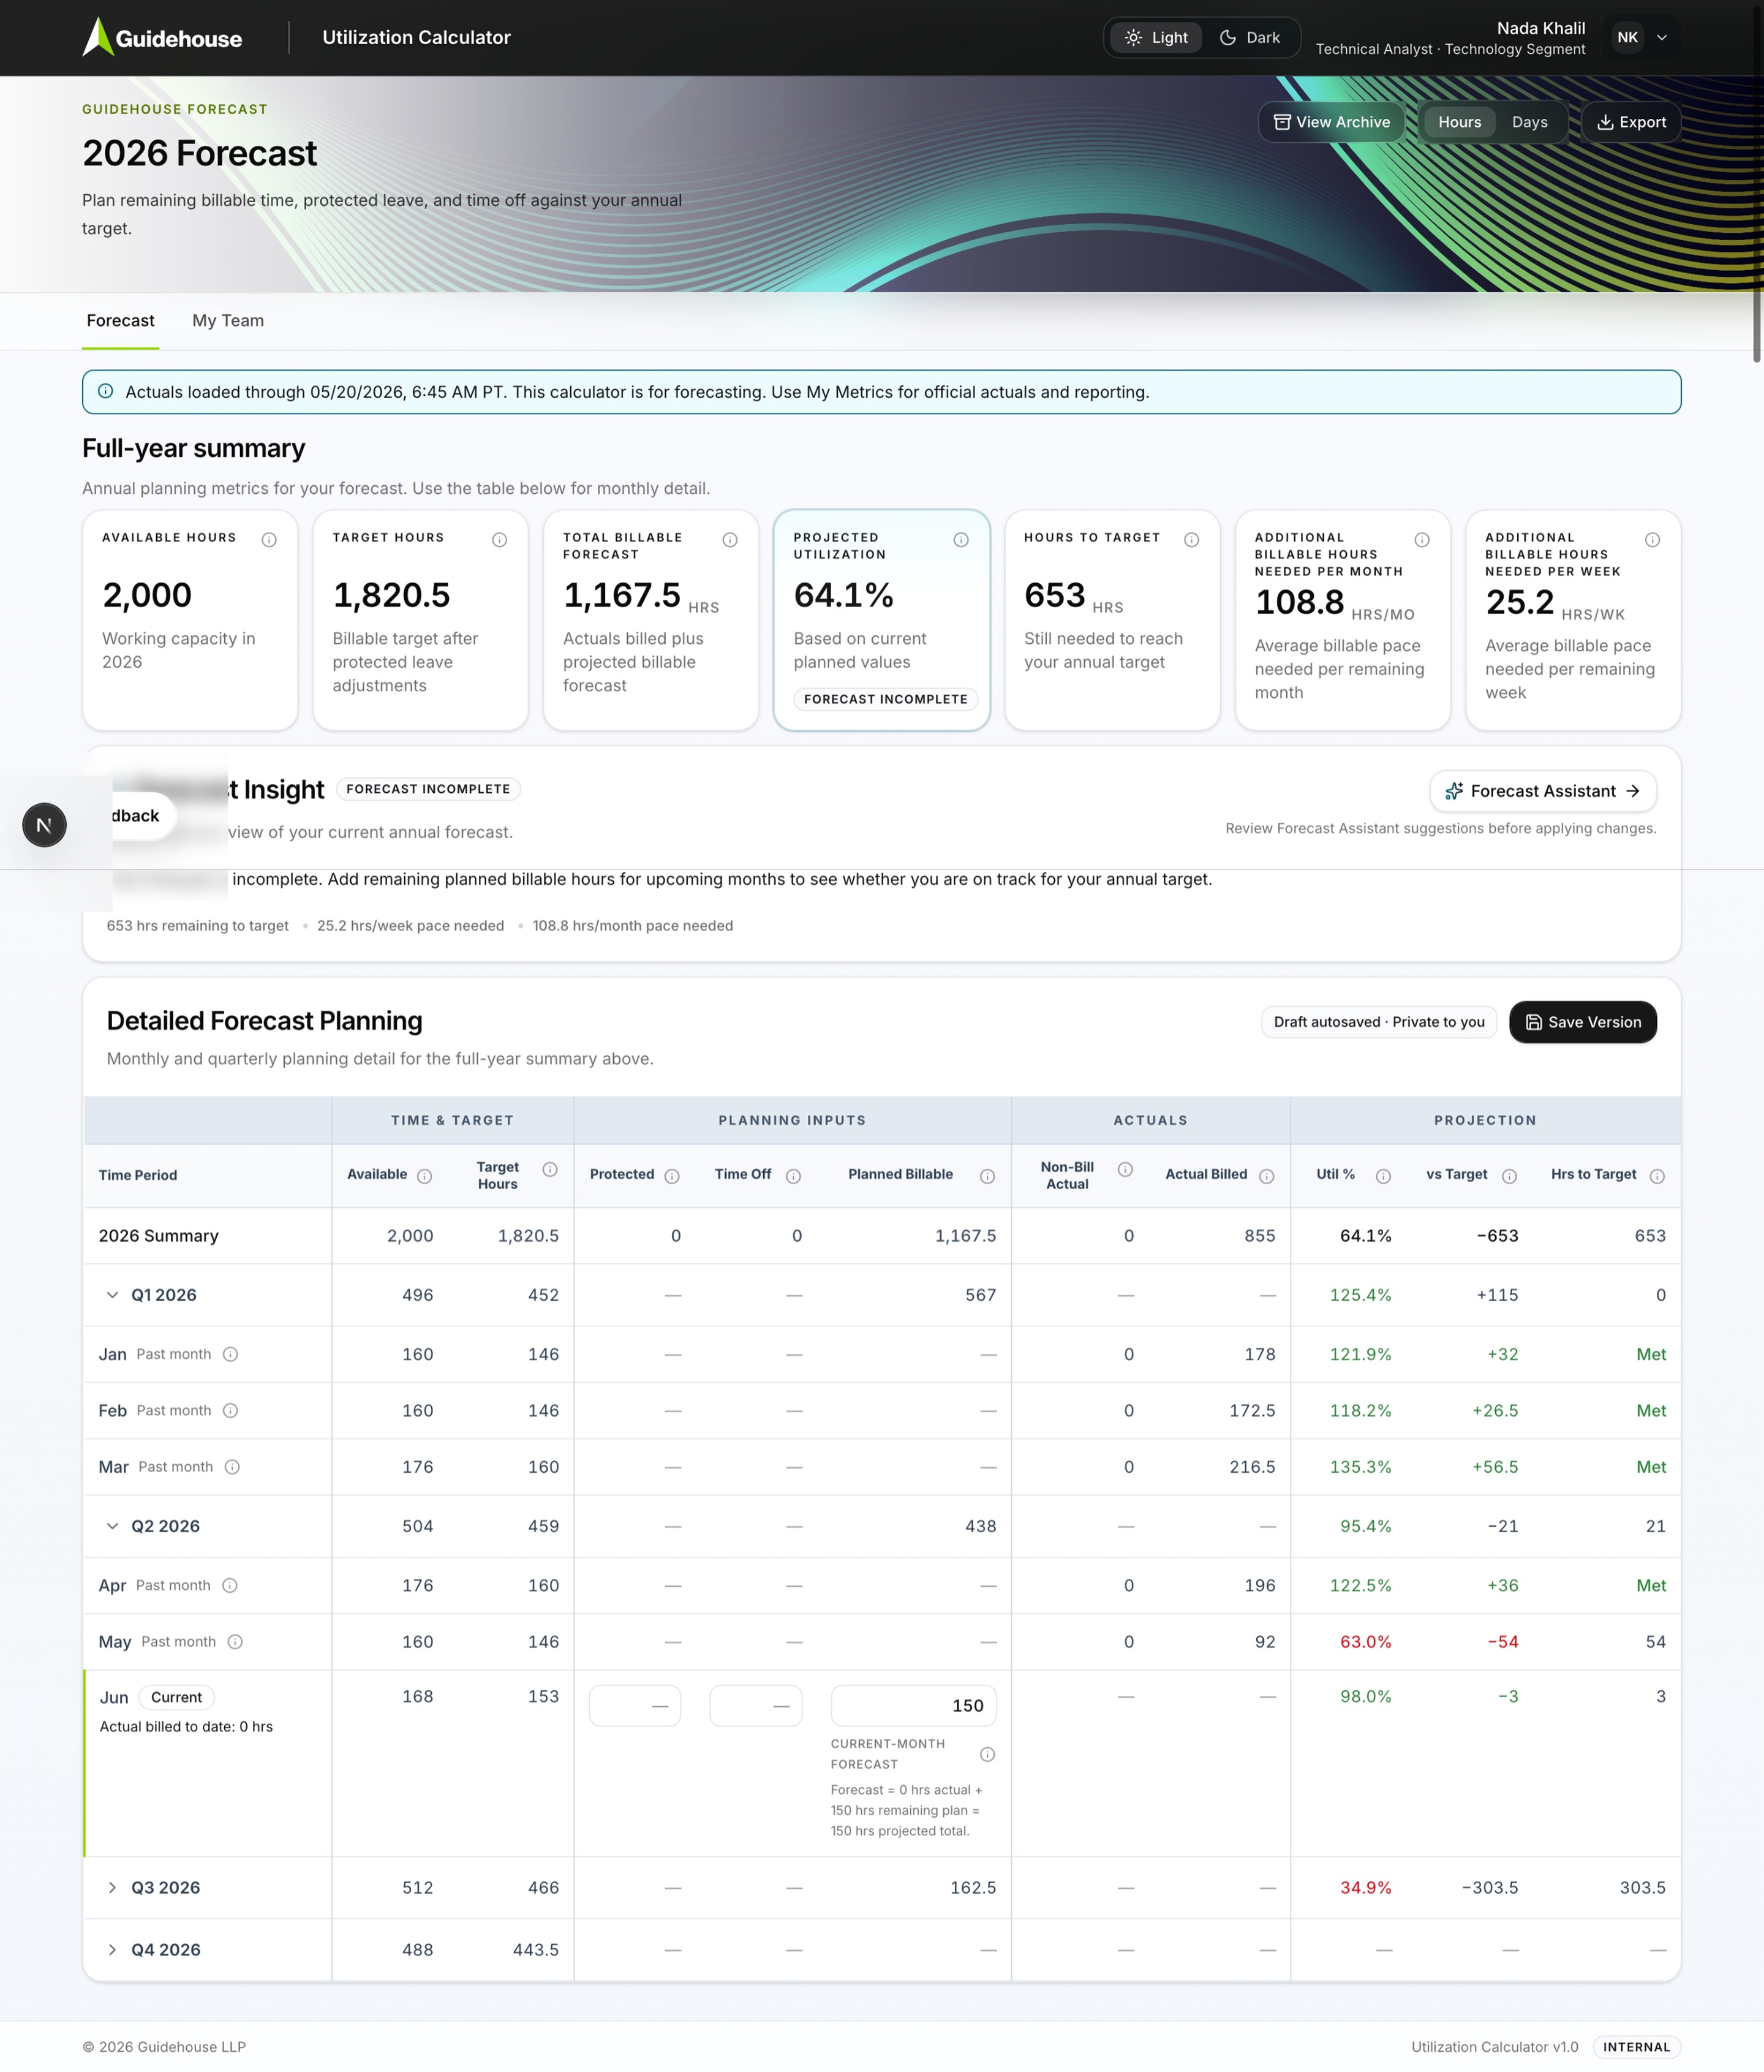
The full-year summary was rebuilt around the questions employees actually ask, in the order they ask them: what's my capacity, what's my target, where will I land, and what pace closes the gap.
- Seven annual metrics: available hours, target hours, total billable forecast, projected utilization, hours to target, and the billable pace needed per month and per week
- A Forecast Incomplete state instead of a false-confidence number. The projection tells you it isn't finished yet
- Planning inputs, actuals, and projections separated into distinct column groups so editable values never look like calculated ones
- Quarterly rollups collapse; the current month stays pinned and explains its own math
Reading the table like a consultant, not an accountant
Past months are labeled. The current month shows its formula in plain language: 0 hrs actual + 150 hrs remaining plan = 150 hrs projected total. That's because the most common question in UAT was “where is this number coming from?”
Trust Architecture
Nothing reaches your manager unless you send it
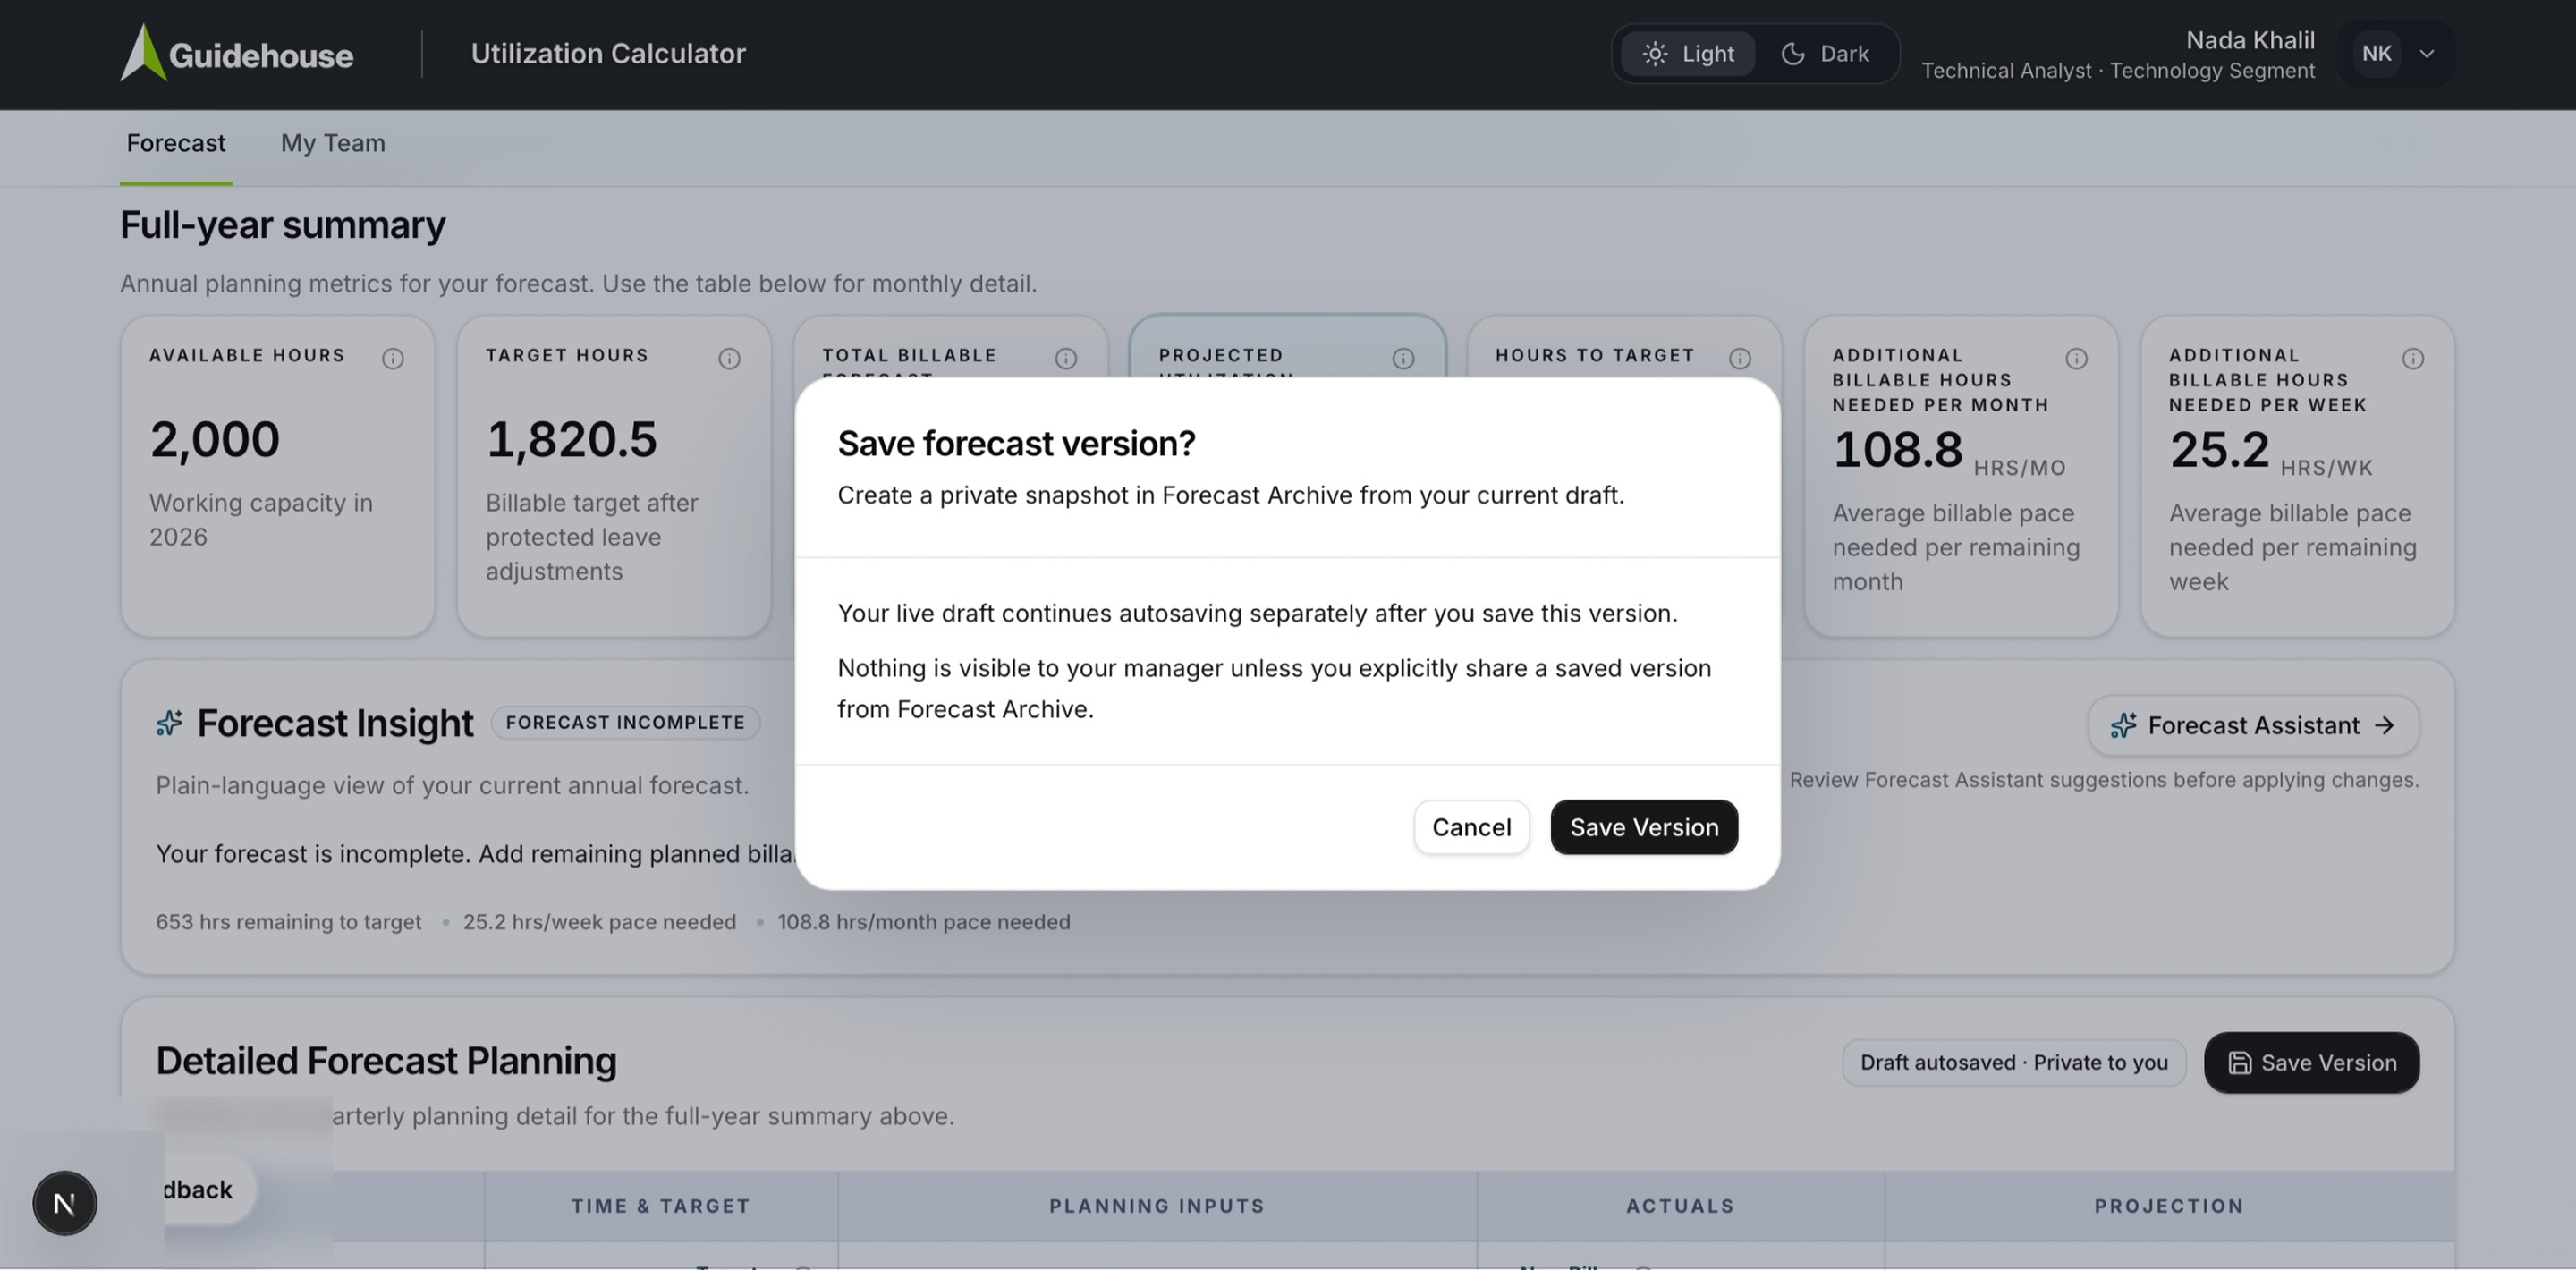
Planning is a rehearsal. People will not model an honest scenario if they think their manager is watching the draft. So visibility became an explicit, three-state system, stated in the UI at every step:
- Draft: autosaved, private to you. Always working, never watched
- Saved version: a private snapshot. Point-in-time, stored in Forecast Archive, still private
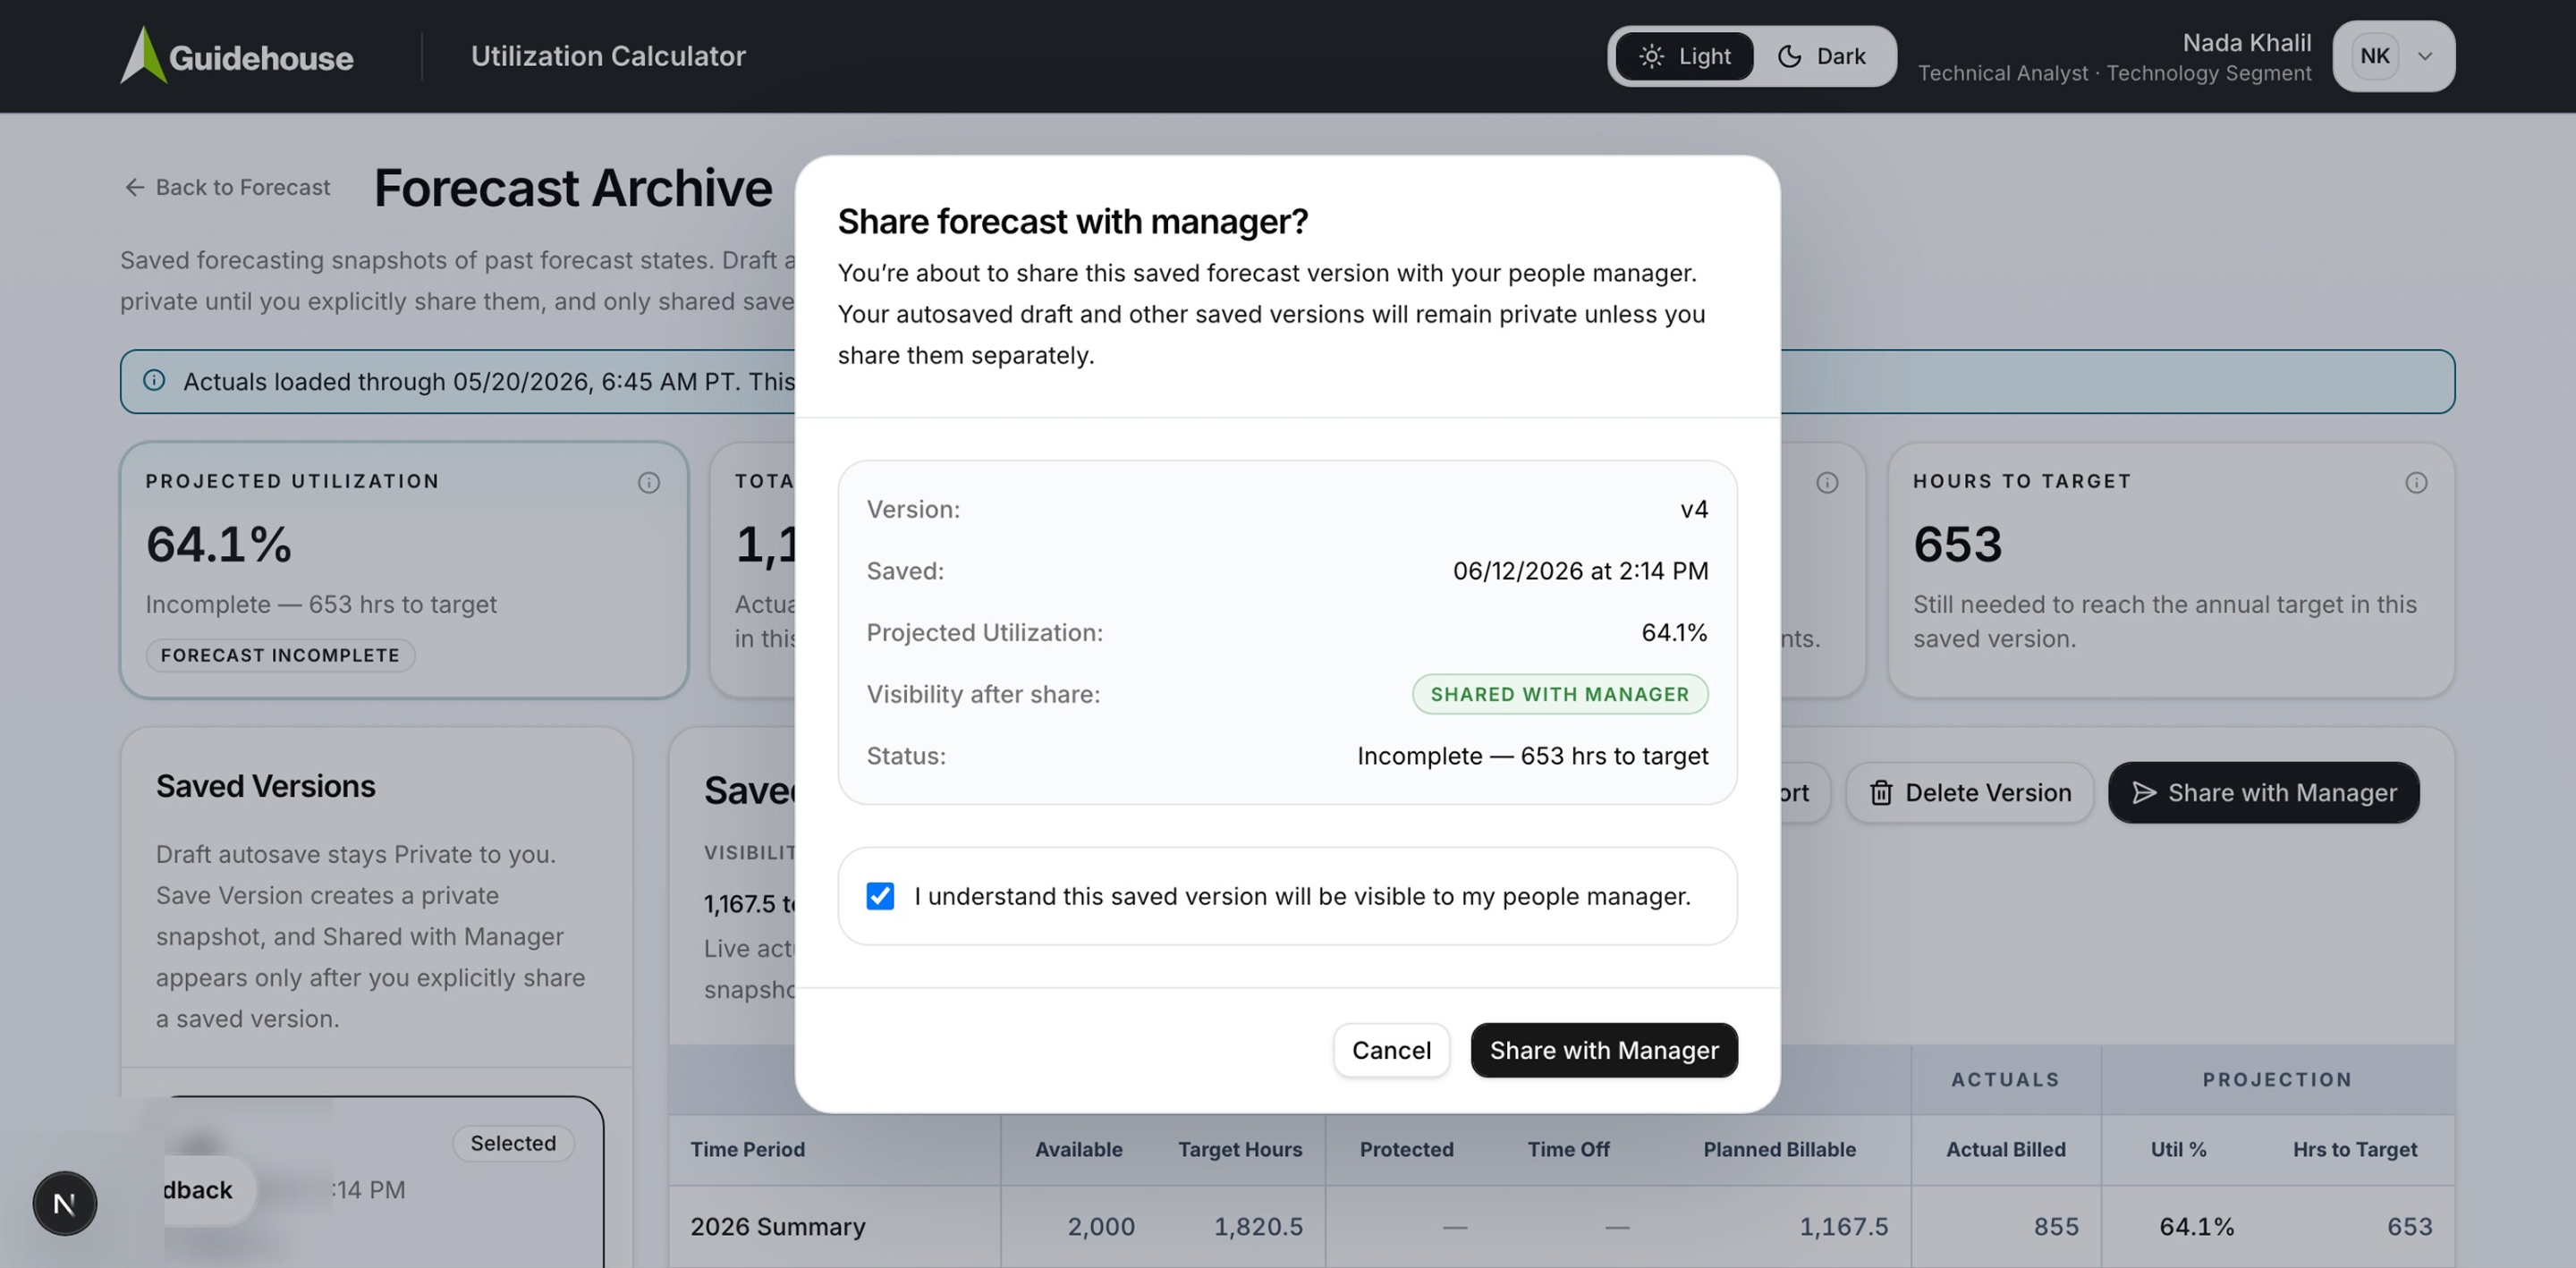
- Shared with Manager: an explicit act. Confirmed, checkboxed, timestamped, and versioned
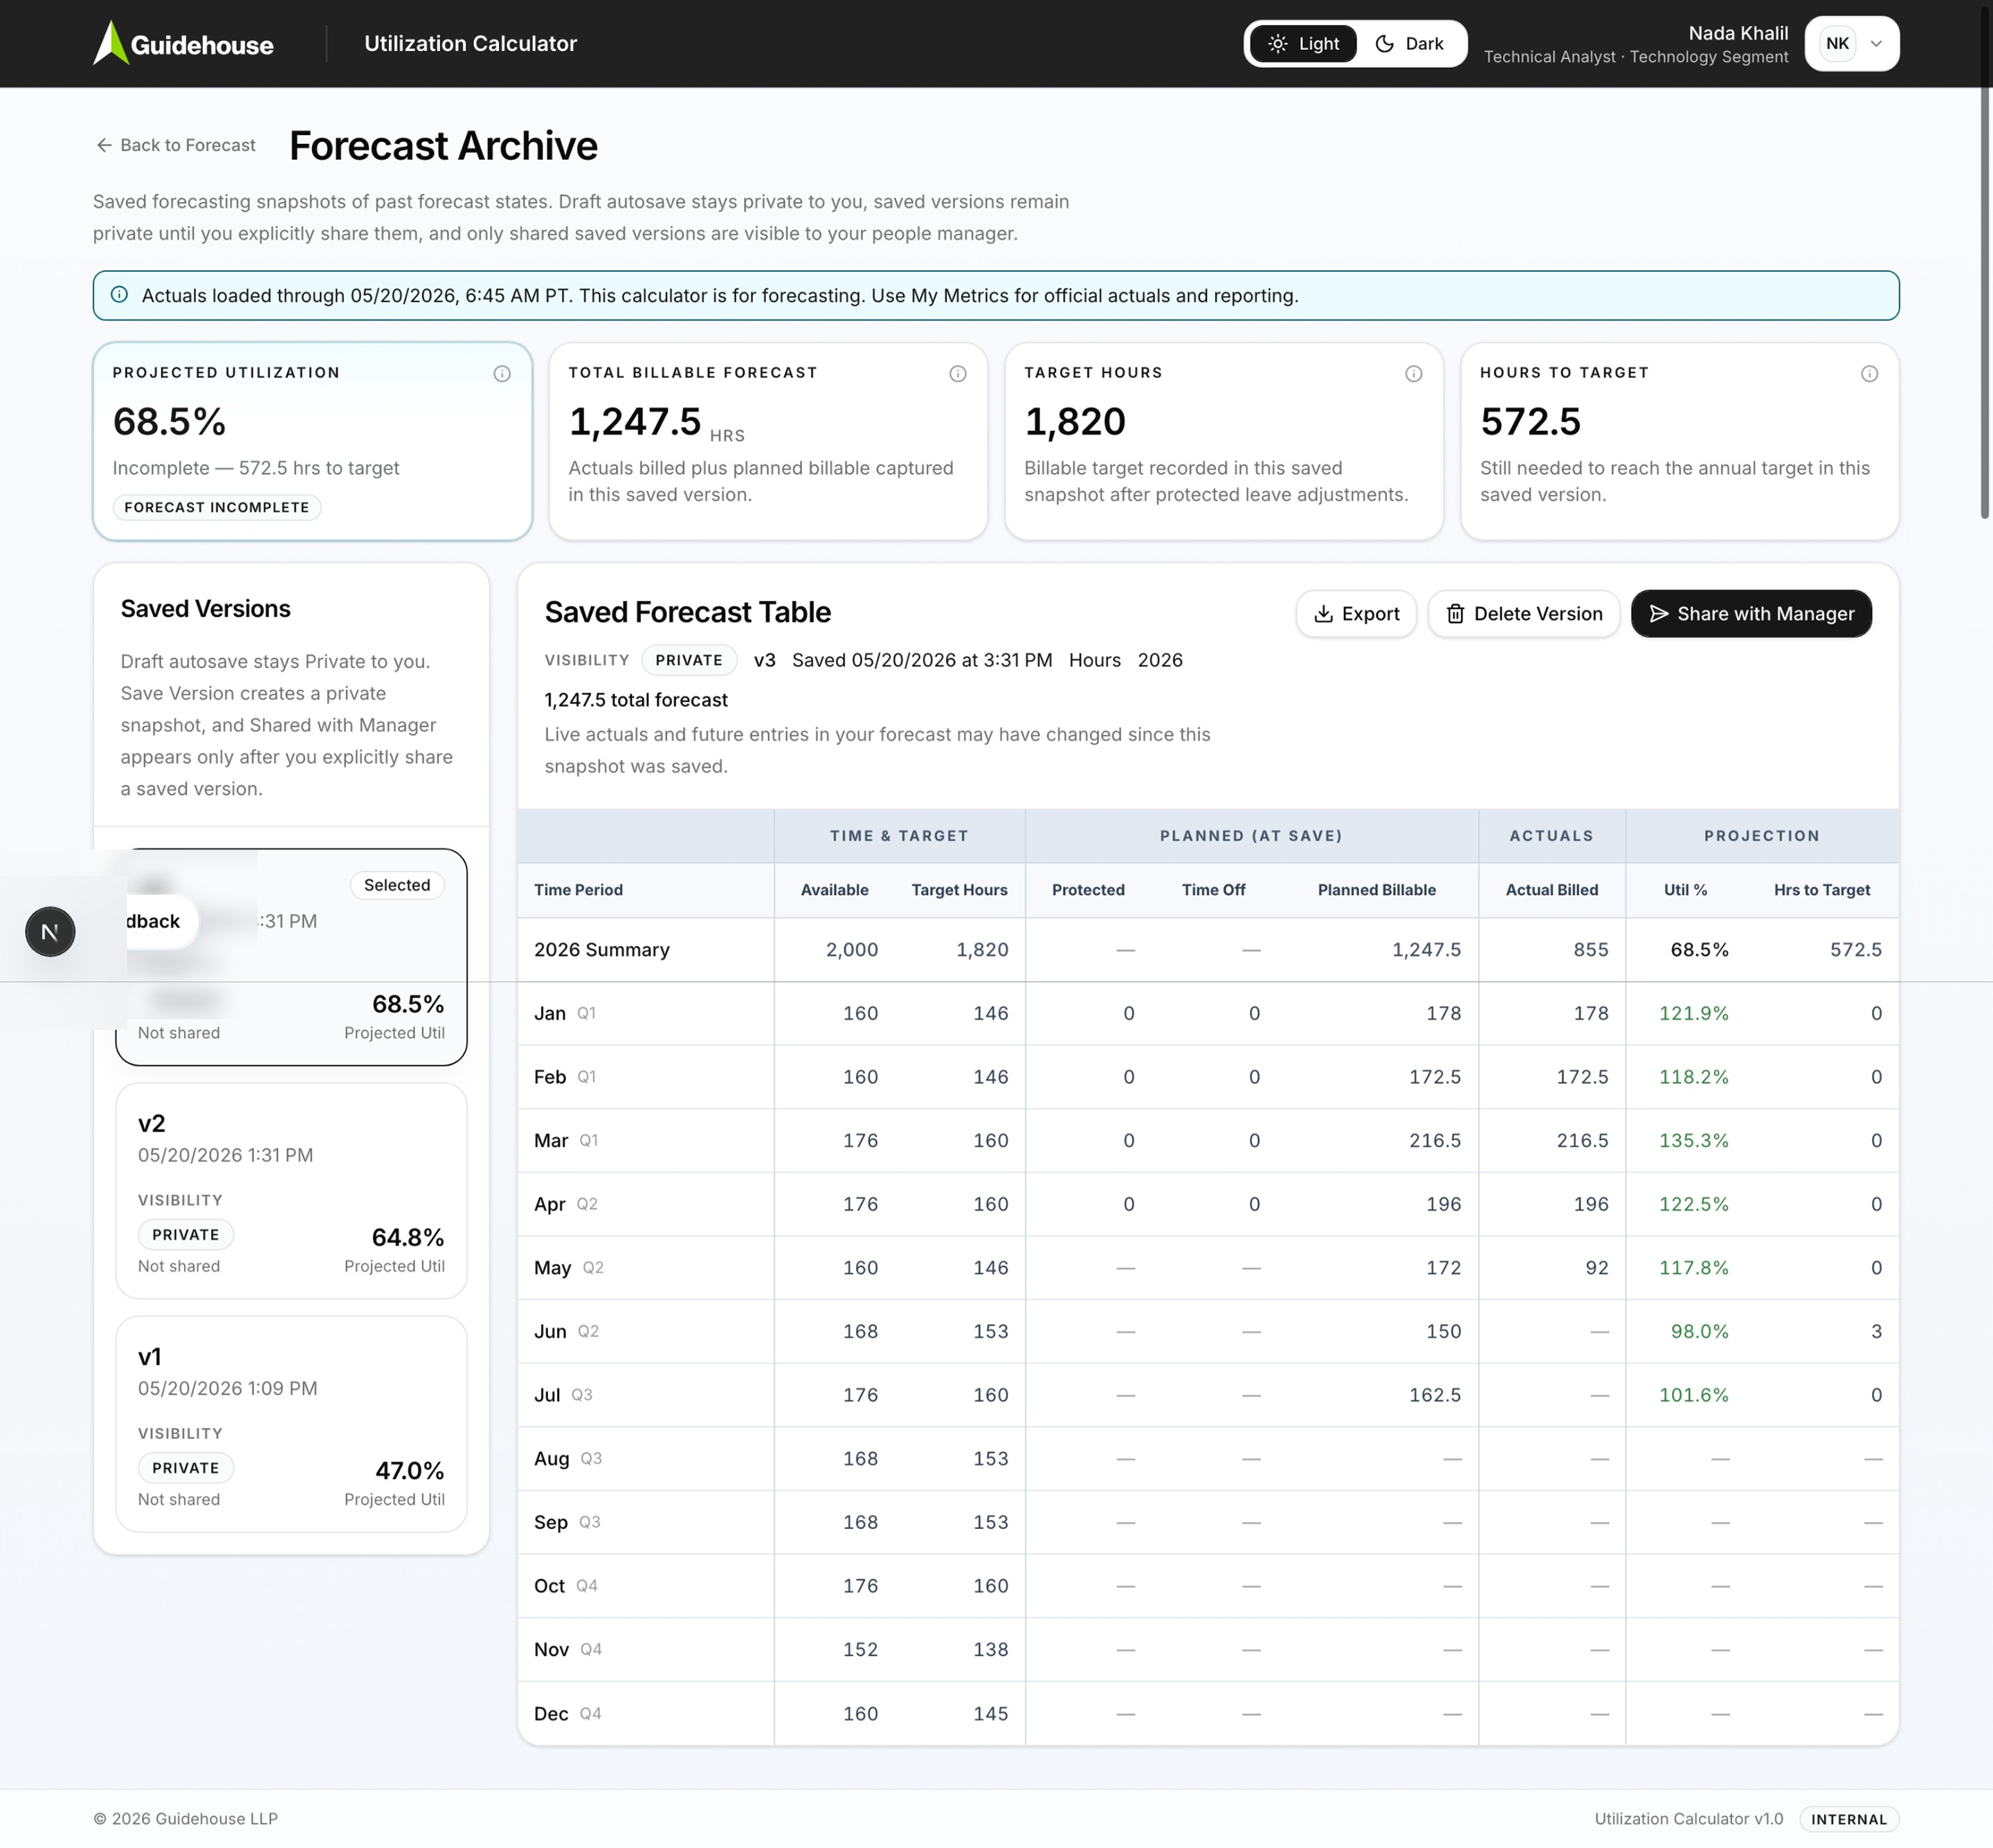
Forecast Archive
Saved versions sit side by side with their projected utilization, so employees can watch their own planning mature (47.0% → 64.8% → 68.5%) and choose which snapshot represents the conversation they want to have.
People Manager view
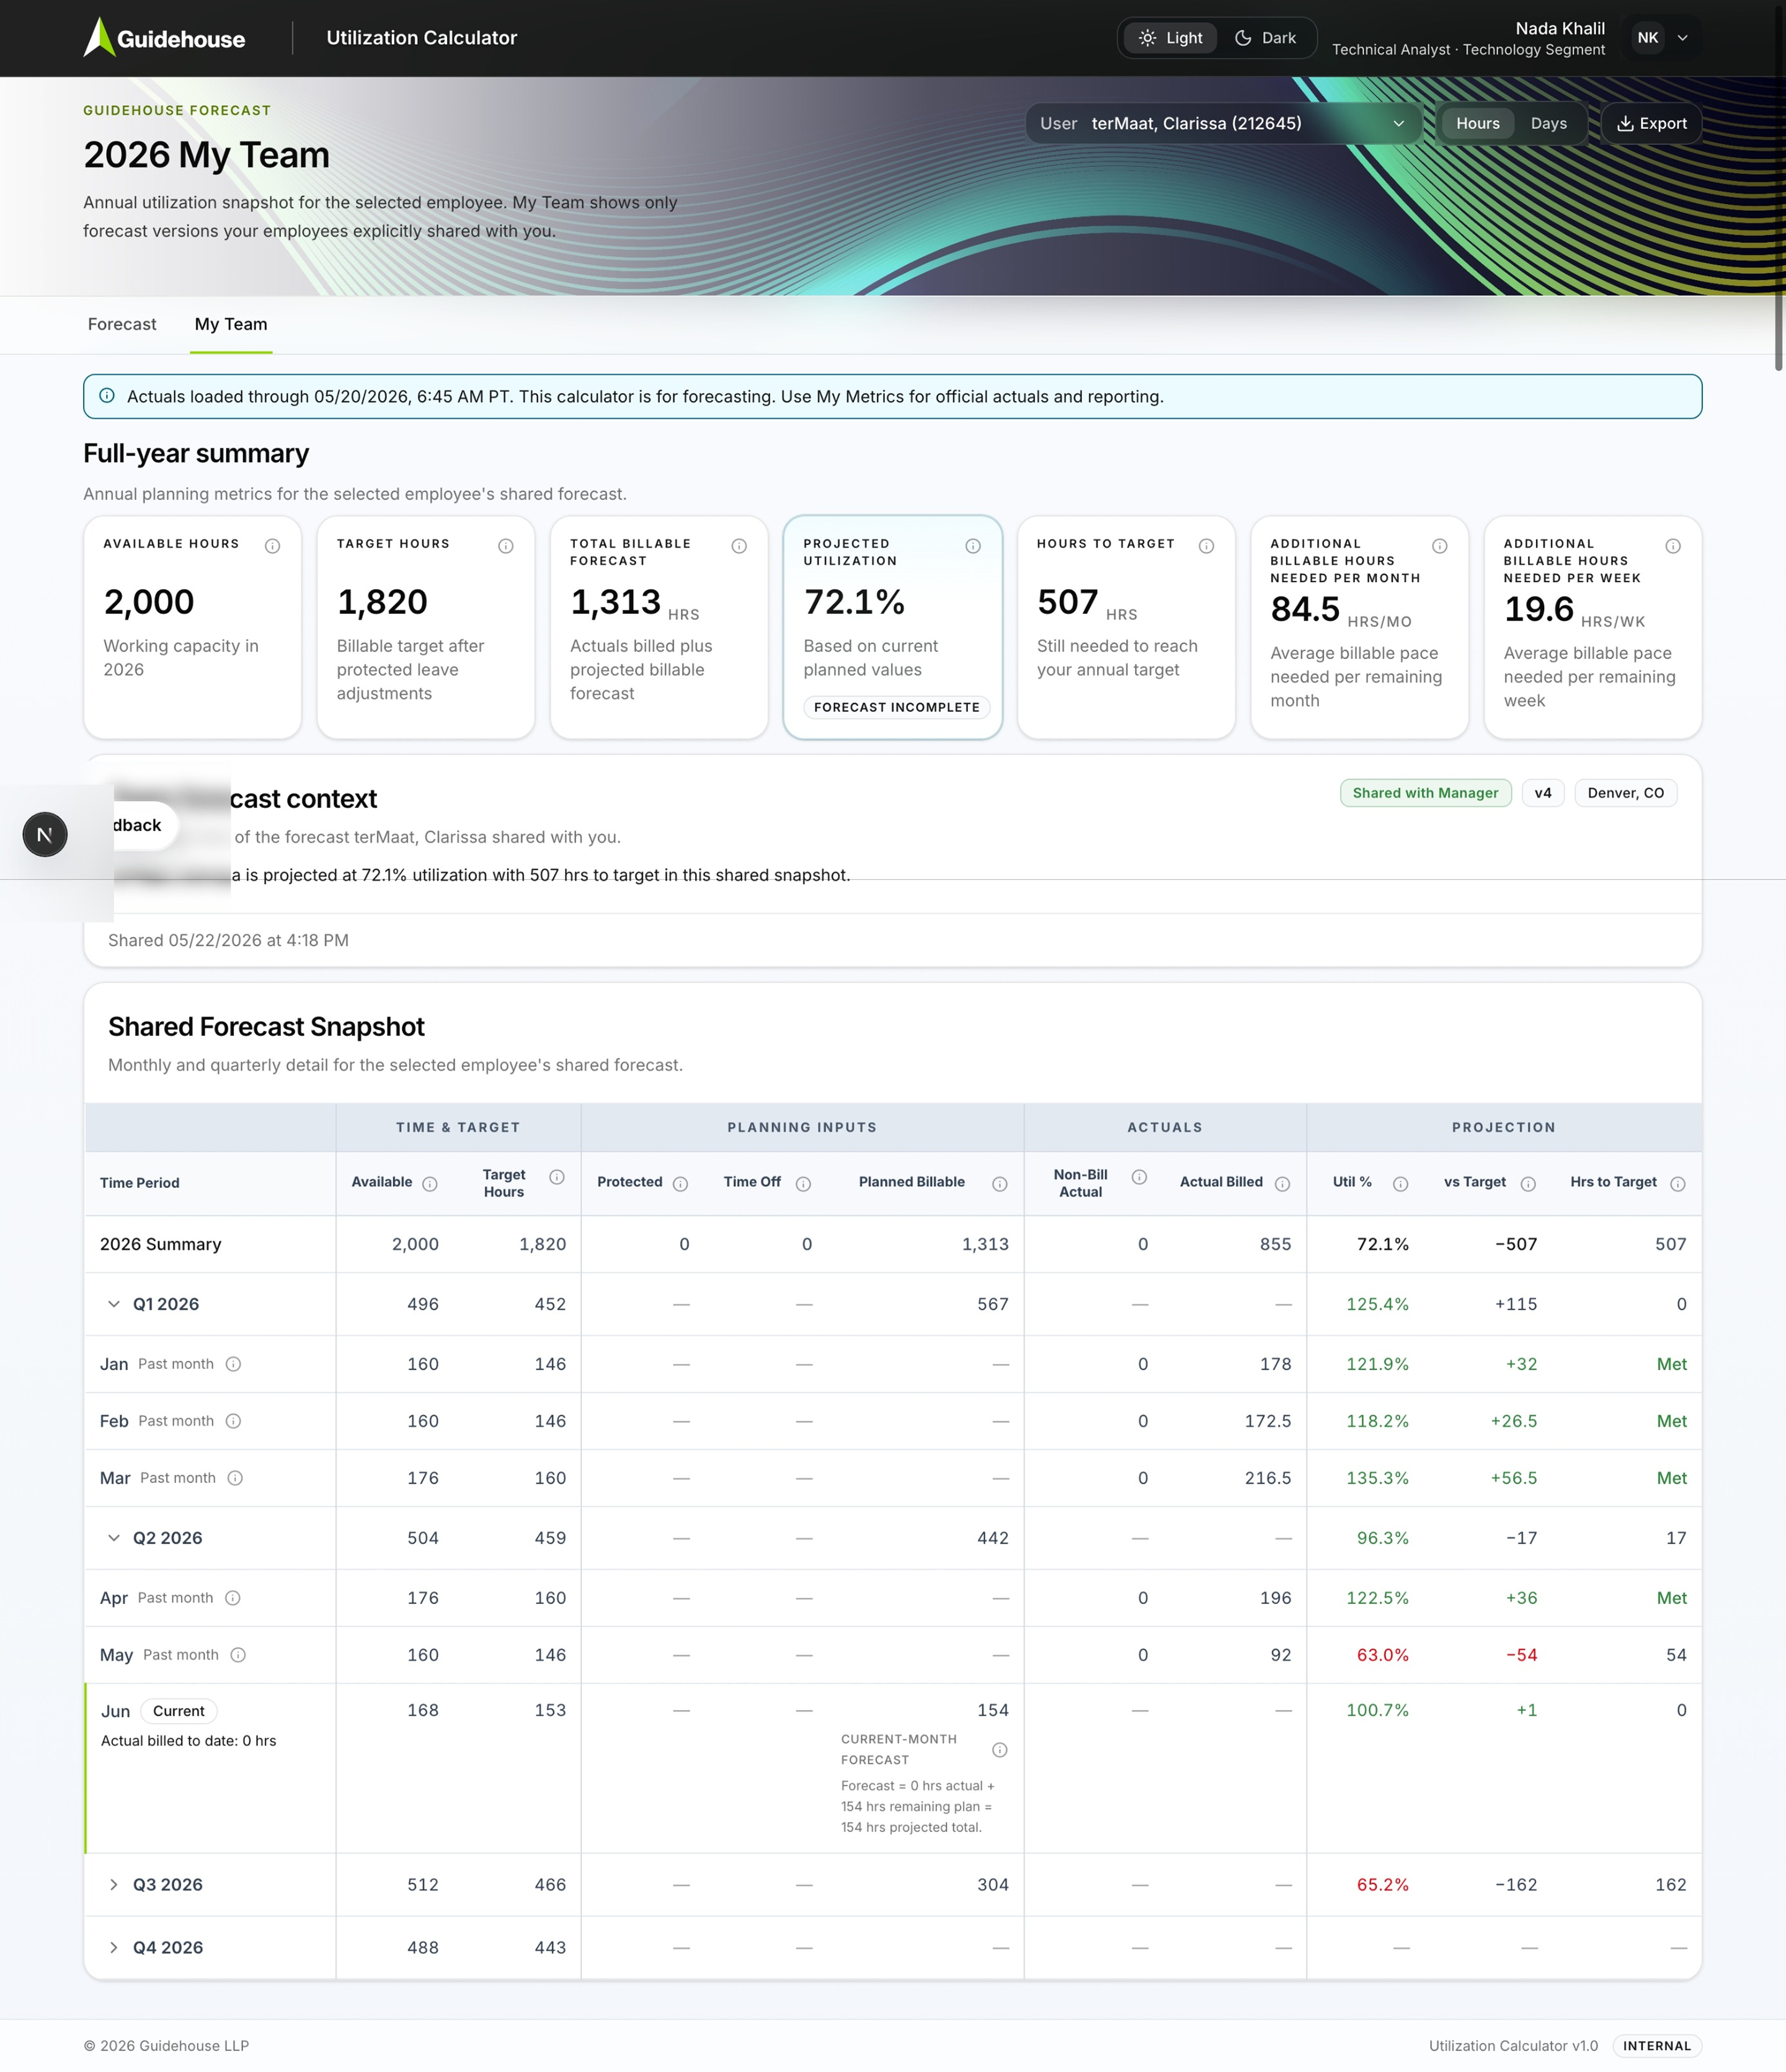
My Team shows only the versions employees explicitly shared, never the live draft. Managers get context, not surveillance: the shared snapshot, its version, when it was shared, and a plain-language summary of where that person is projected to land.
AI Strategy
Not a chatbot. A planning assistant
Phase 2 introduced AI as a practical planning aid rather than a conversational interface. Two surfaces, both designed to reduce planning effort without taking the pen out of the user's hand.
Forecast Insight: the numbers, in a sentence
A plain-language read of the current annual forecast, with pace figures underneath: hours remaining to target, hours/week needed, hours/month needed. It never congratulates; it states.
Forecast Assistant: three questions, one draft
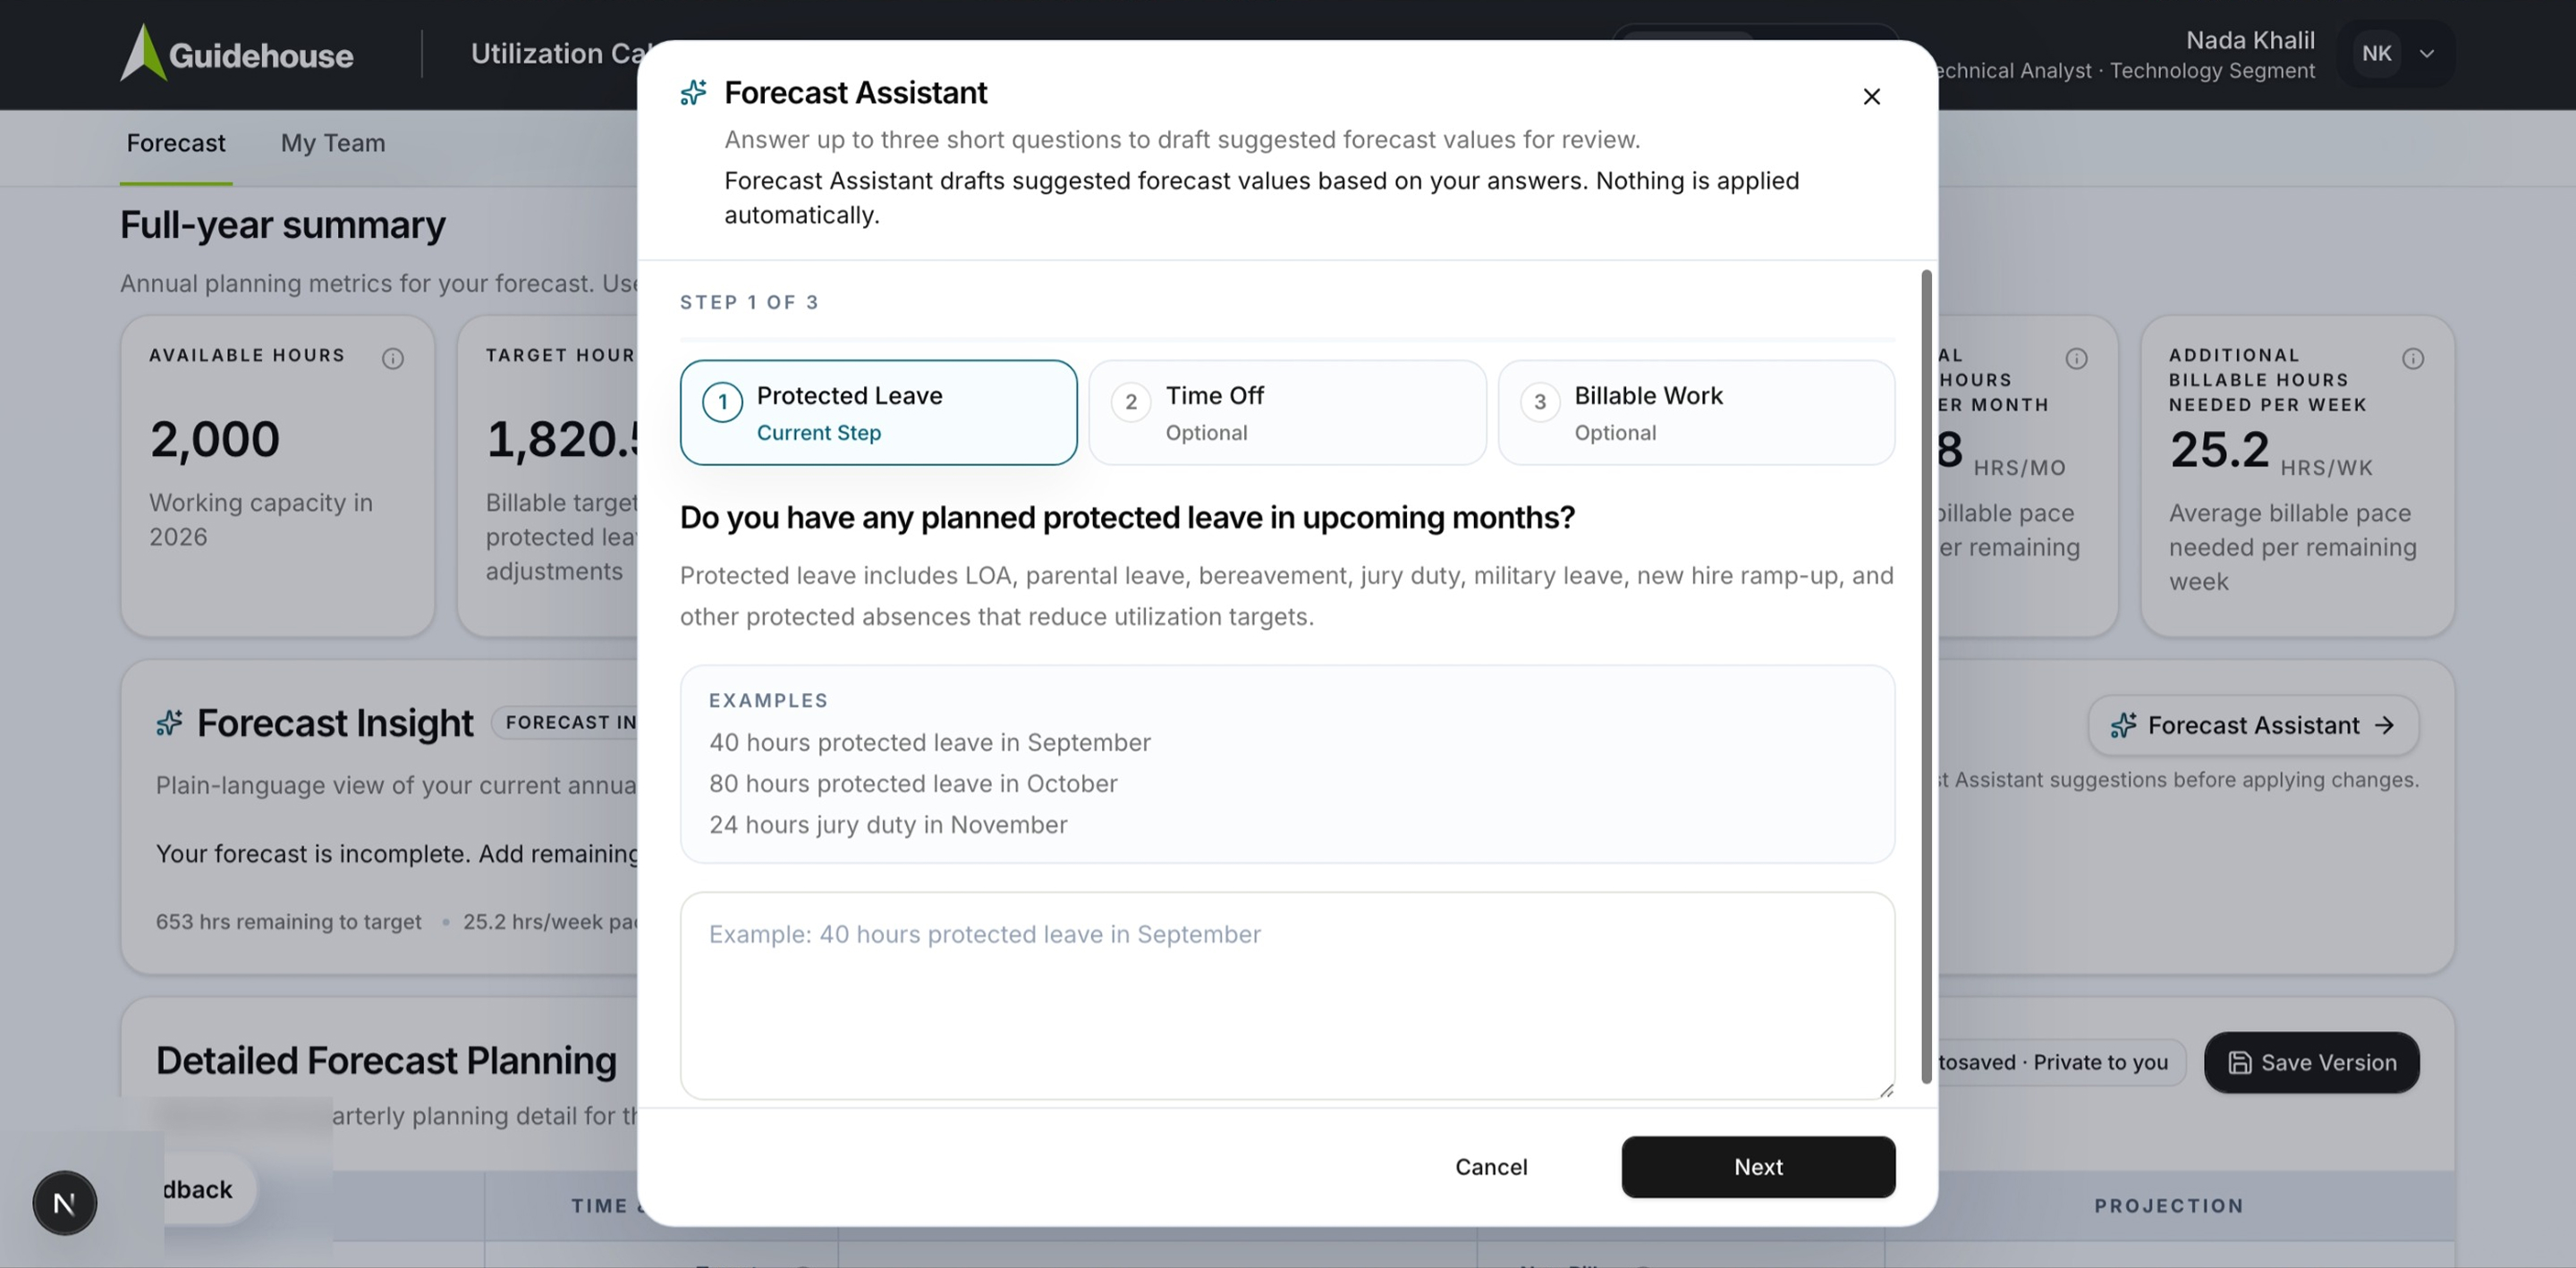
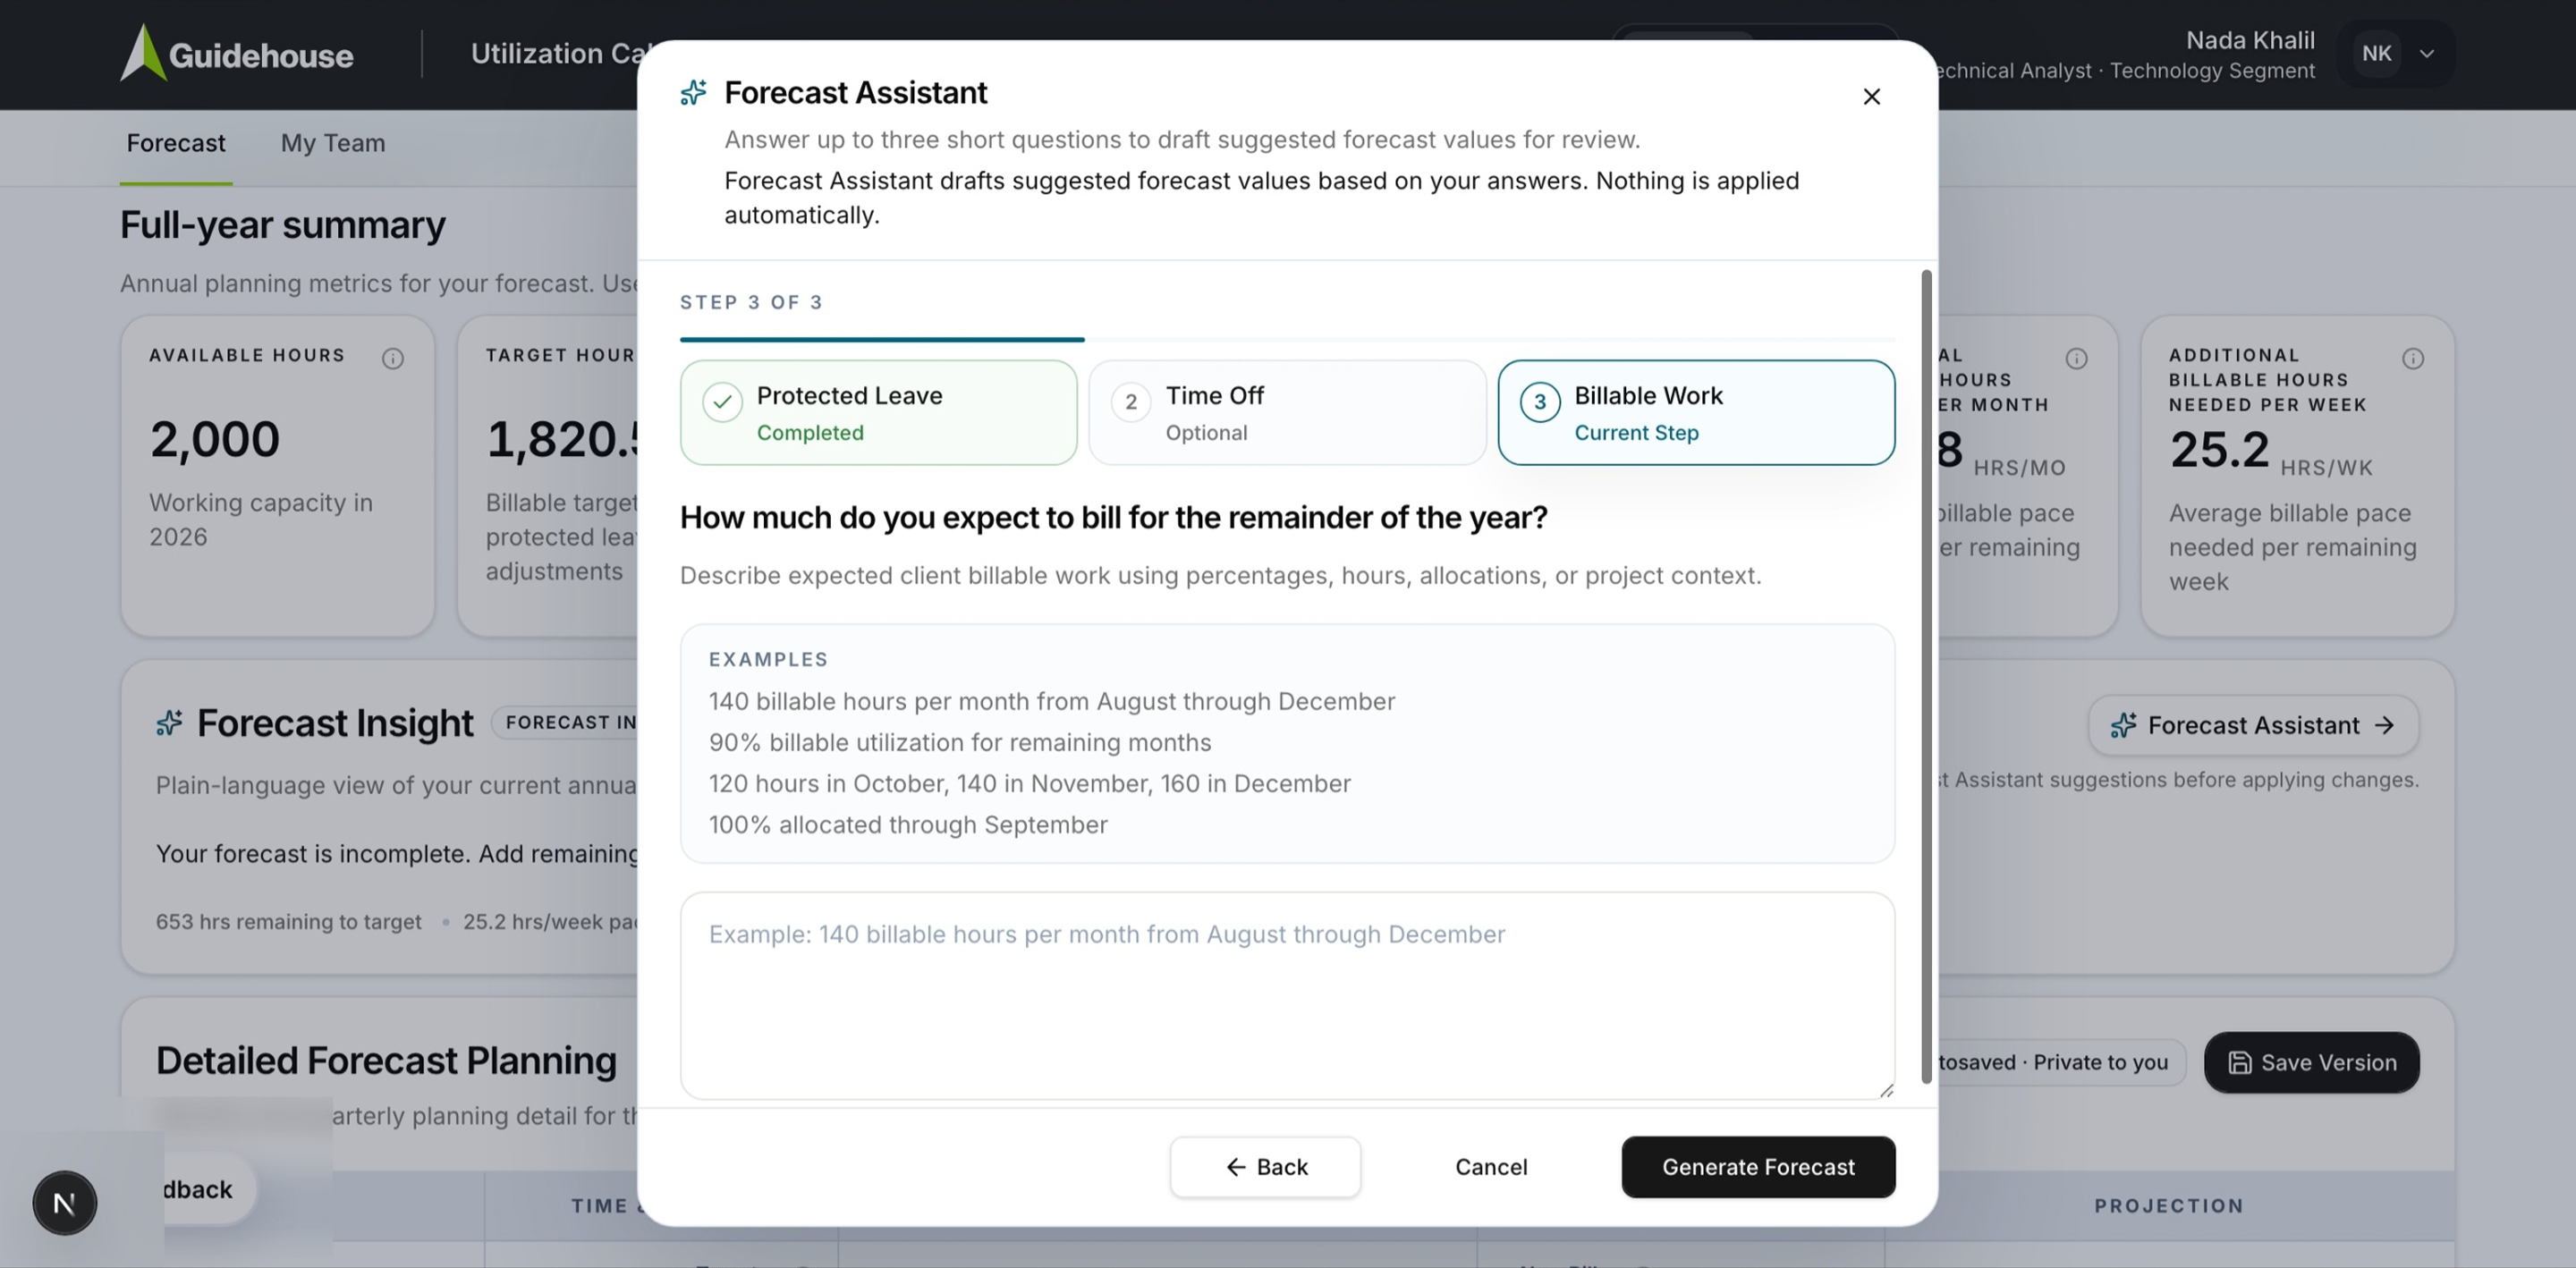
Instead of asking employees to translate their year into a table, the assistant asks how they already think about it:
- Do you have any planned protected leave in upcoming months? (LOA, parental, bereavement, jury duty, military, new-hire ramp-up)
- Do you have any upcoming time off? (DTO, vacation, floating holidays)
- How much do you expect to bill for the remainder of the year? (in hours, percentages, allocations, or project context)
Free text in, structured forecast values out.
The review step is the design
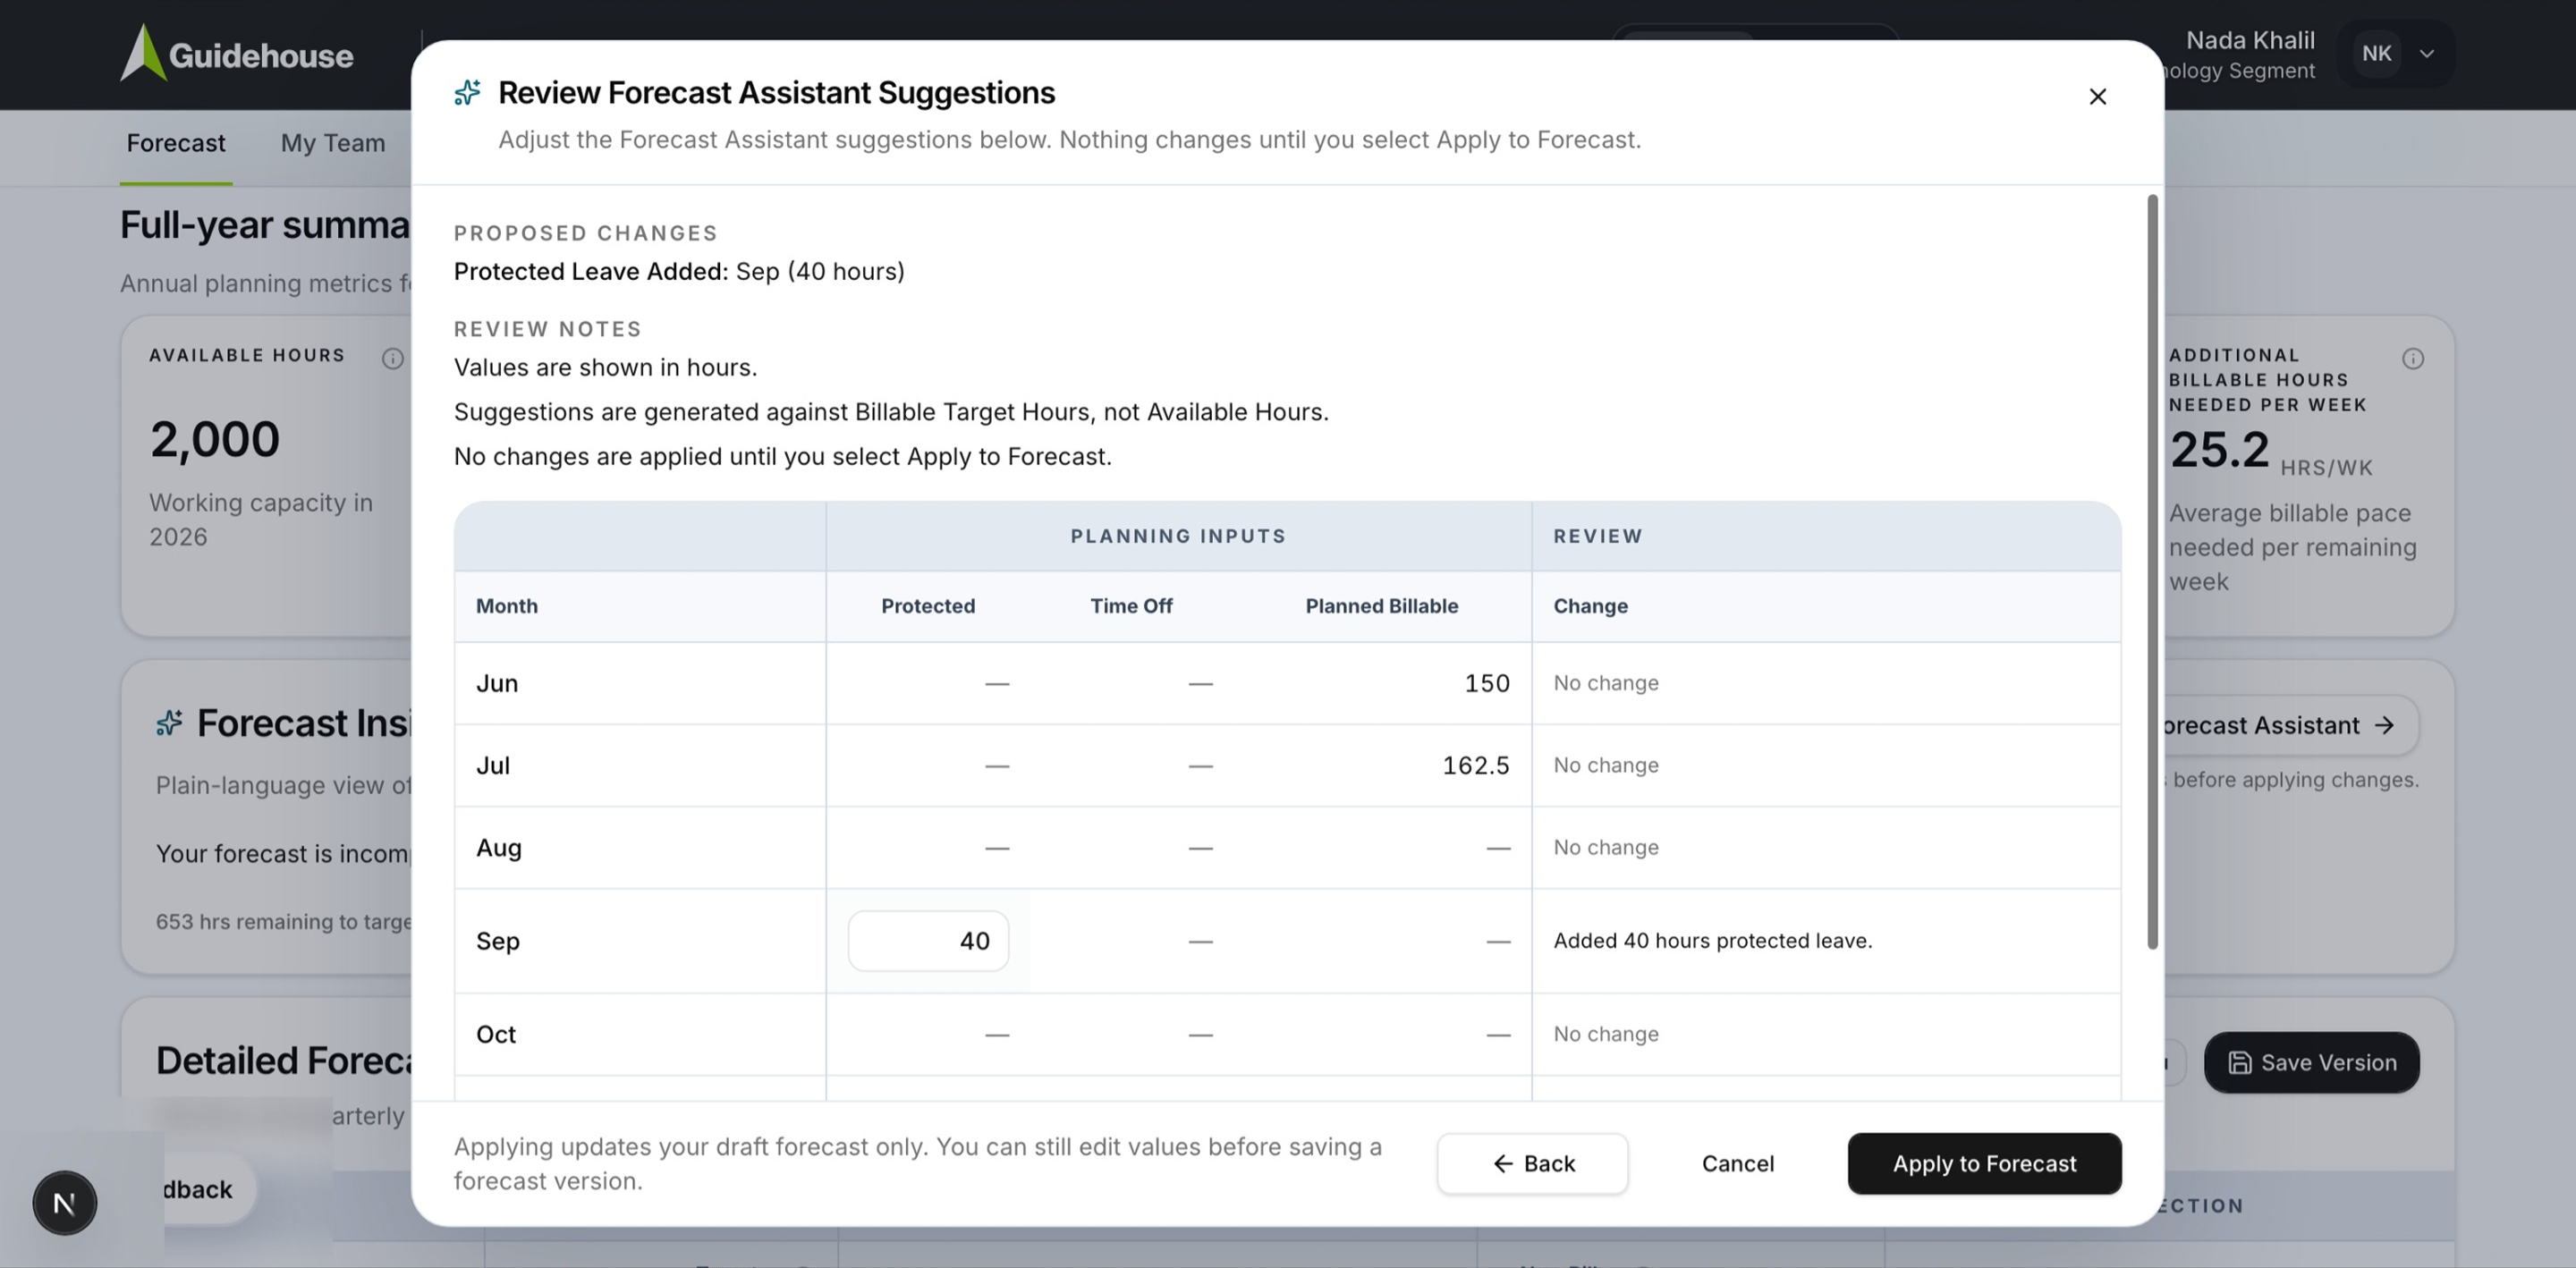
The assistant never writes to the forecast. It proposes. A review table shows every month, what changed, and what didn't: “Added 40 hours protected leave” next to four rows of “No change.” The guardrails are printed above it. Values are in hours, suggestions are generated against billable target hours, and nothing applies until you select Apply to Forecast.
Operations
The admin console is part of the product
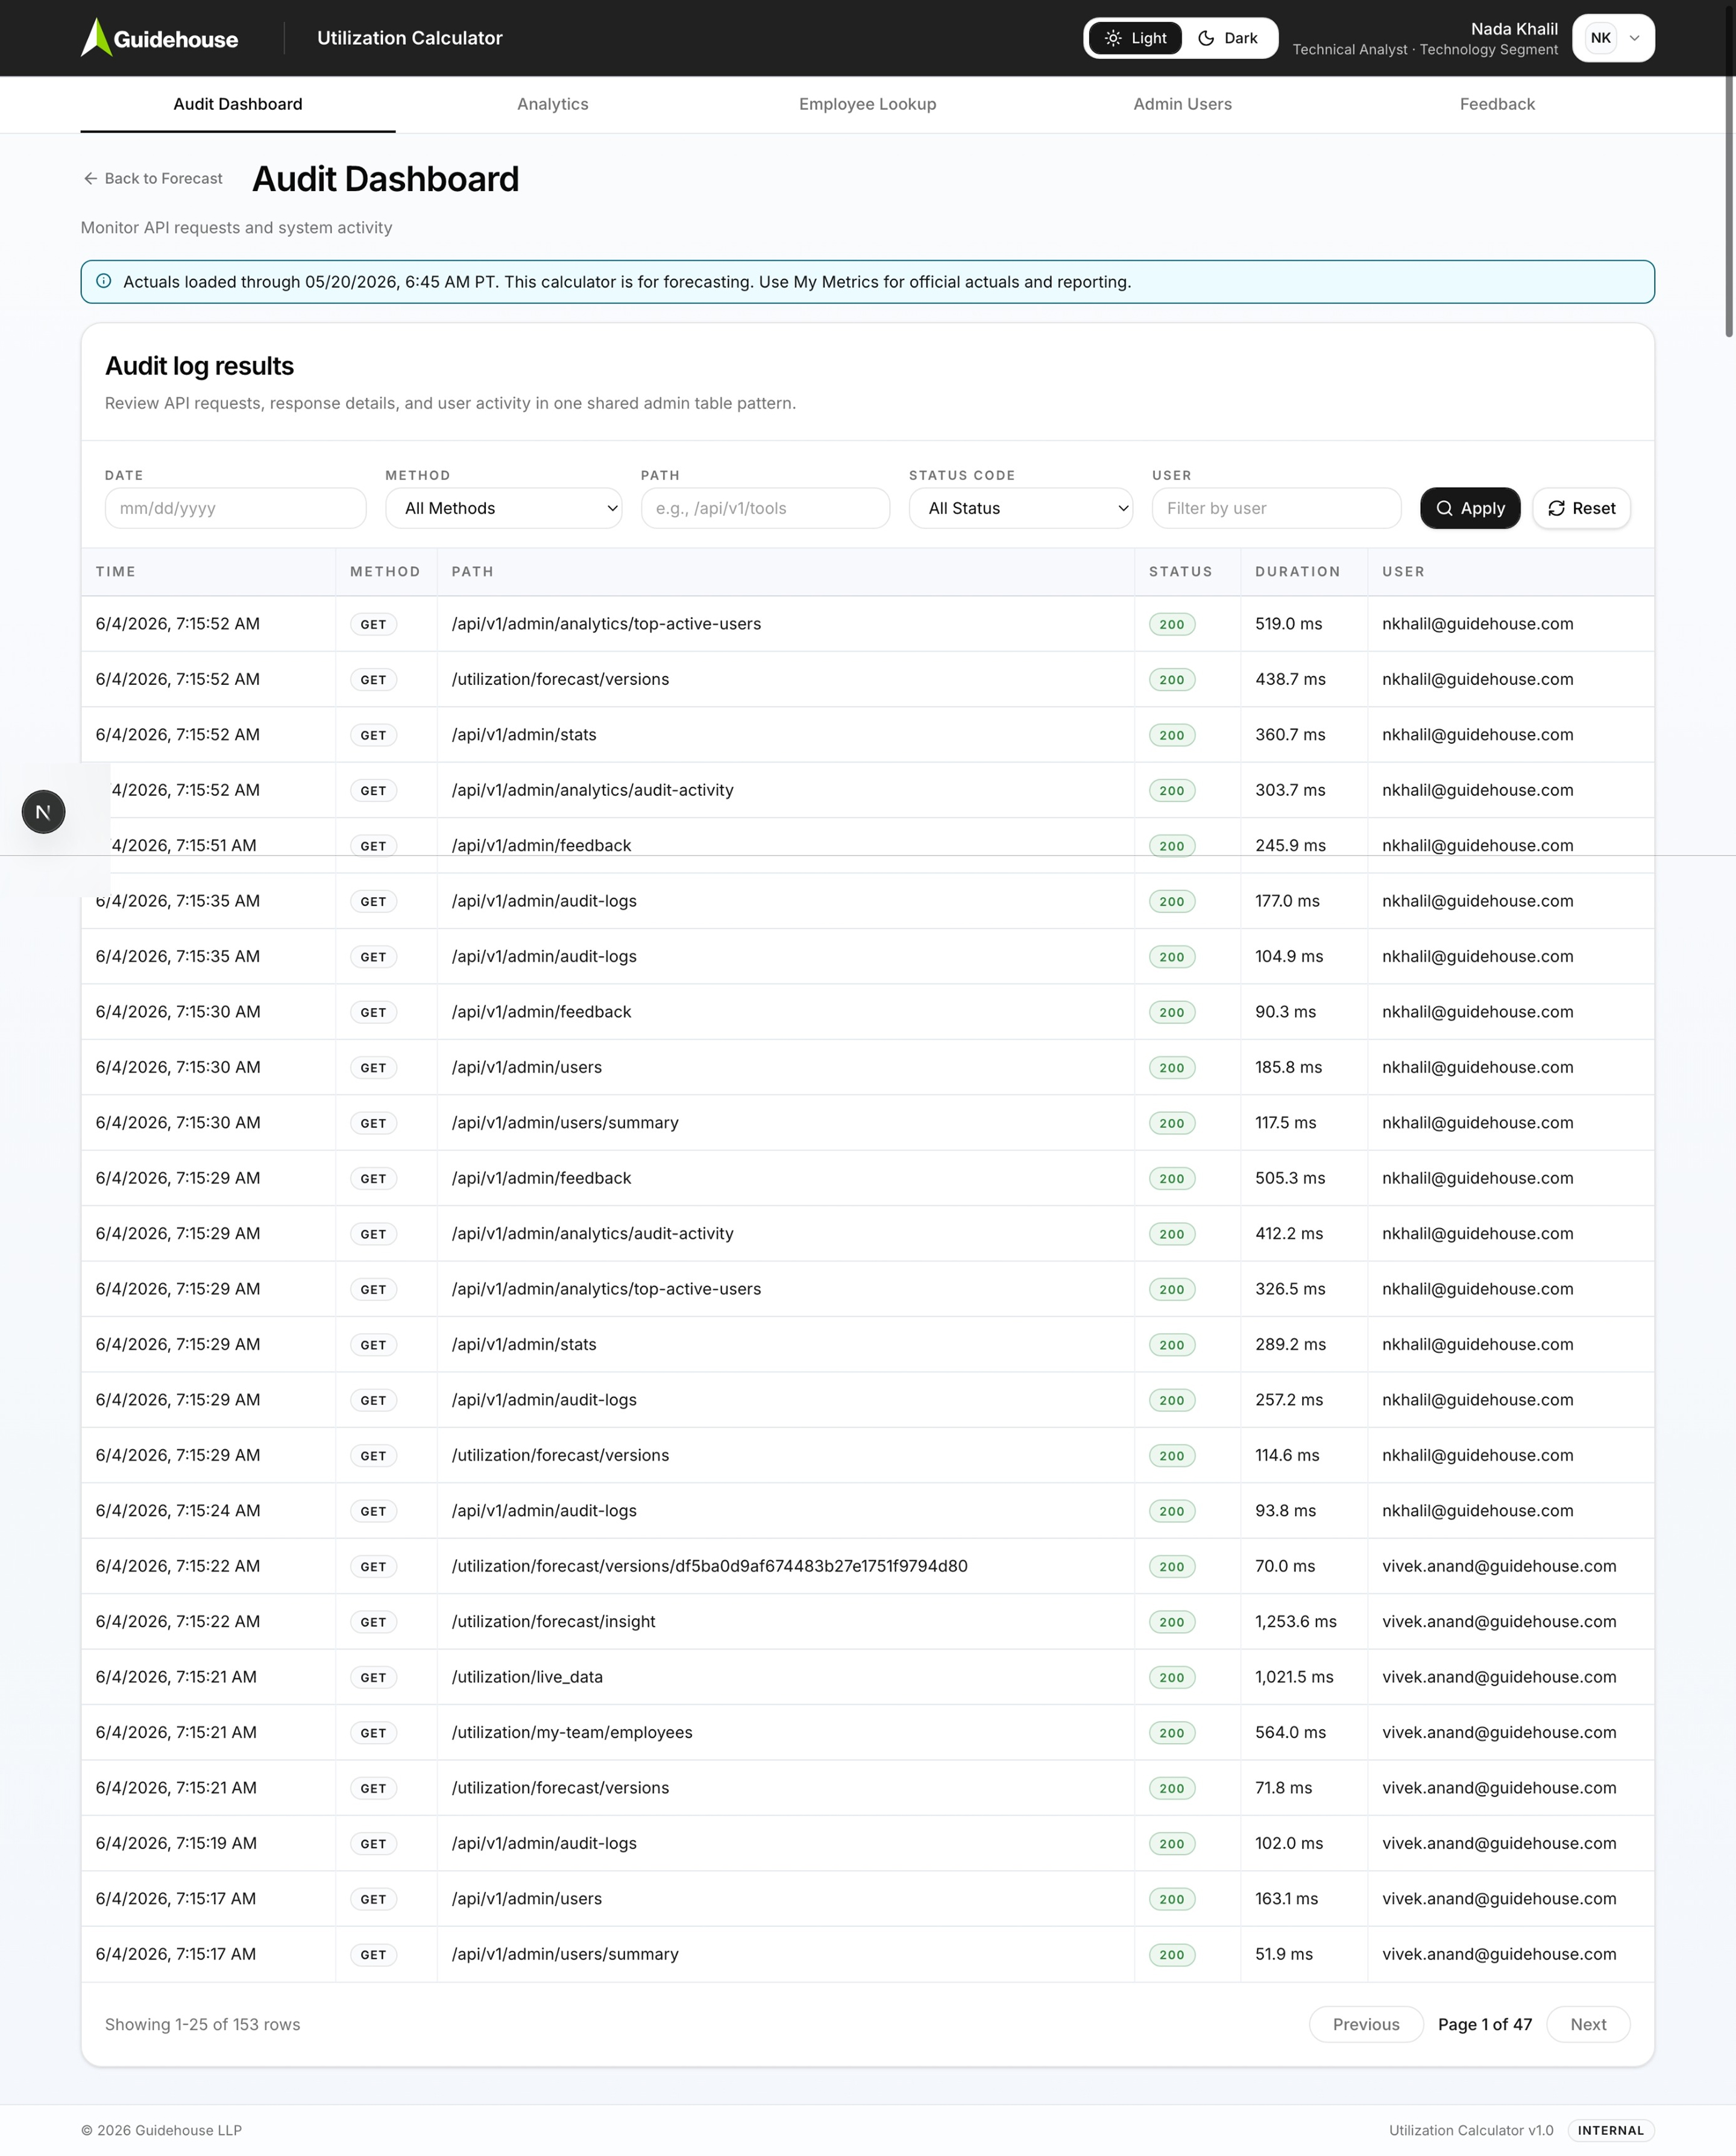
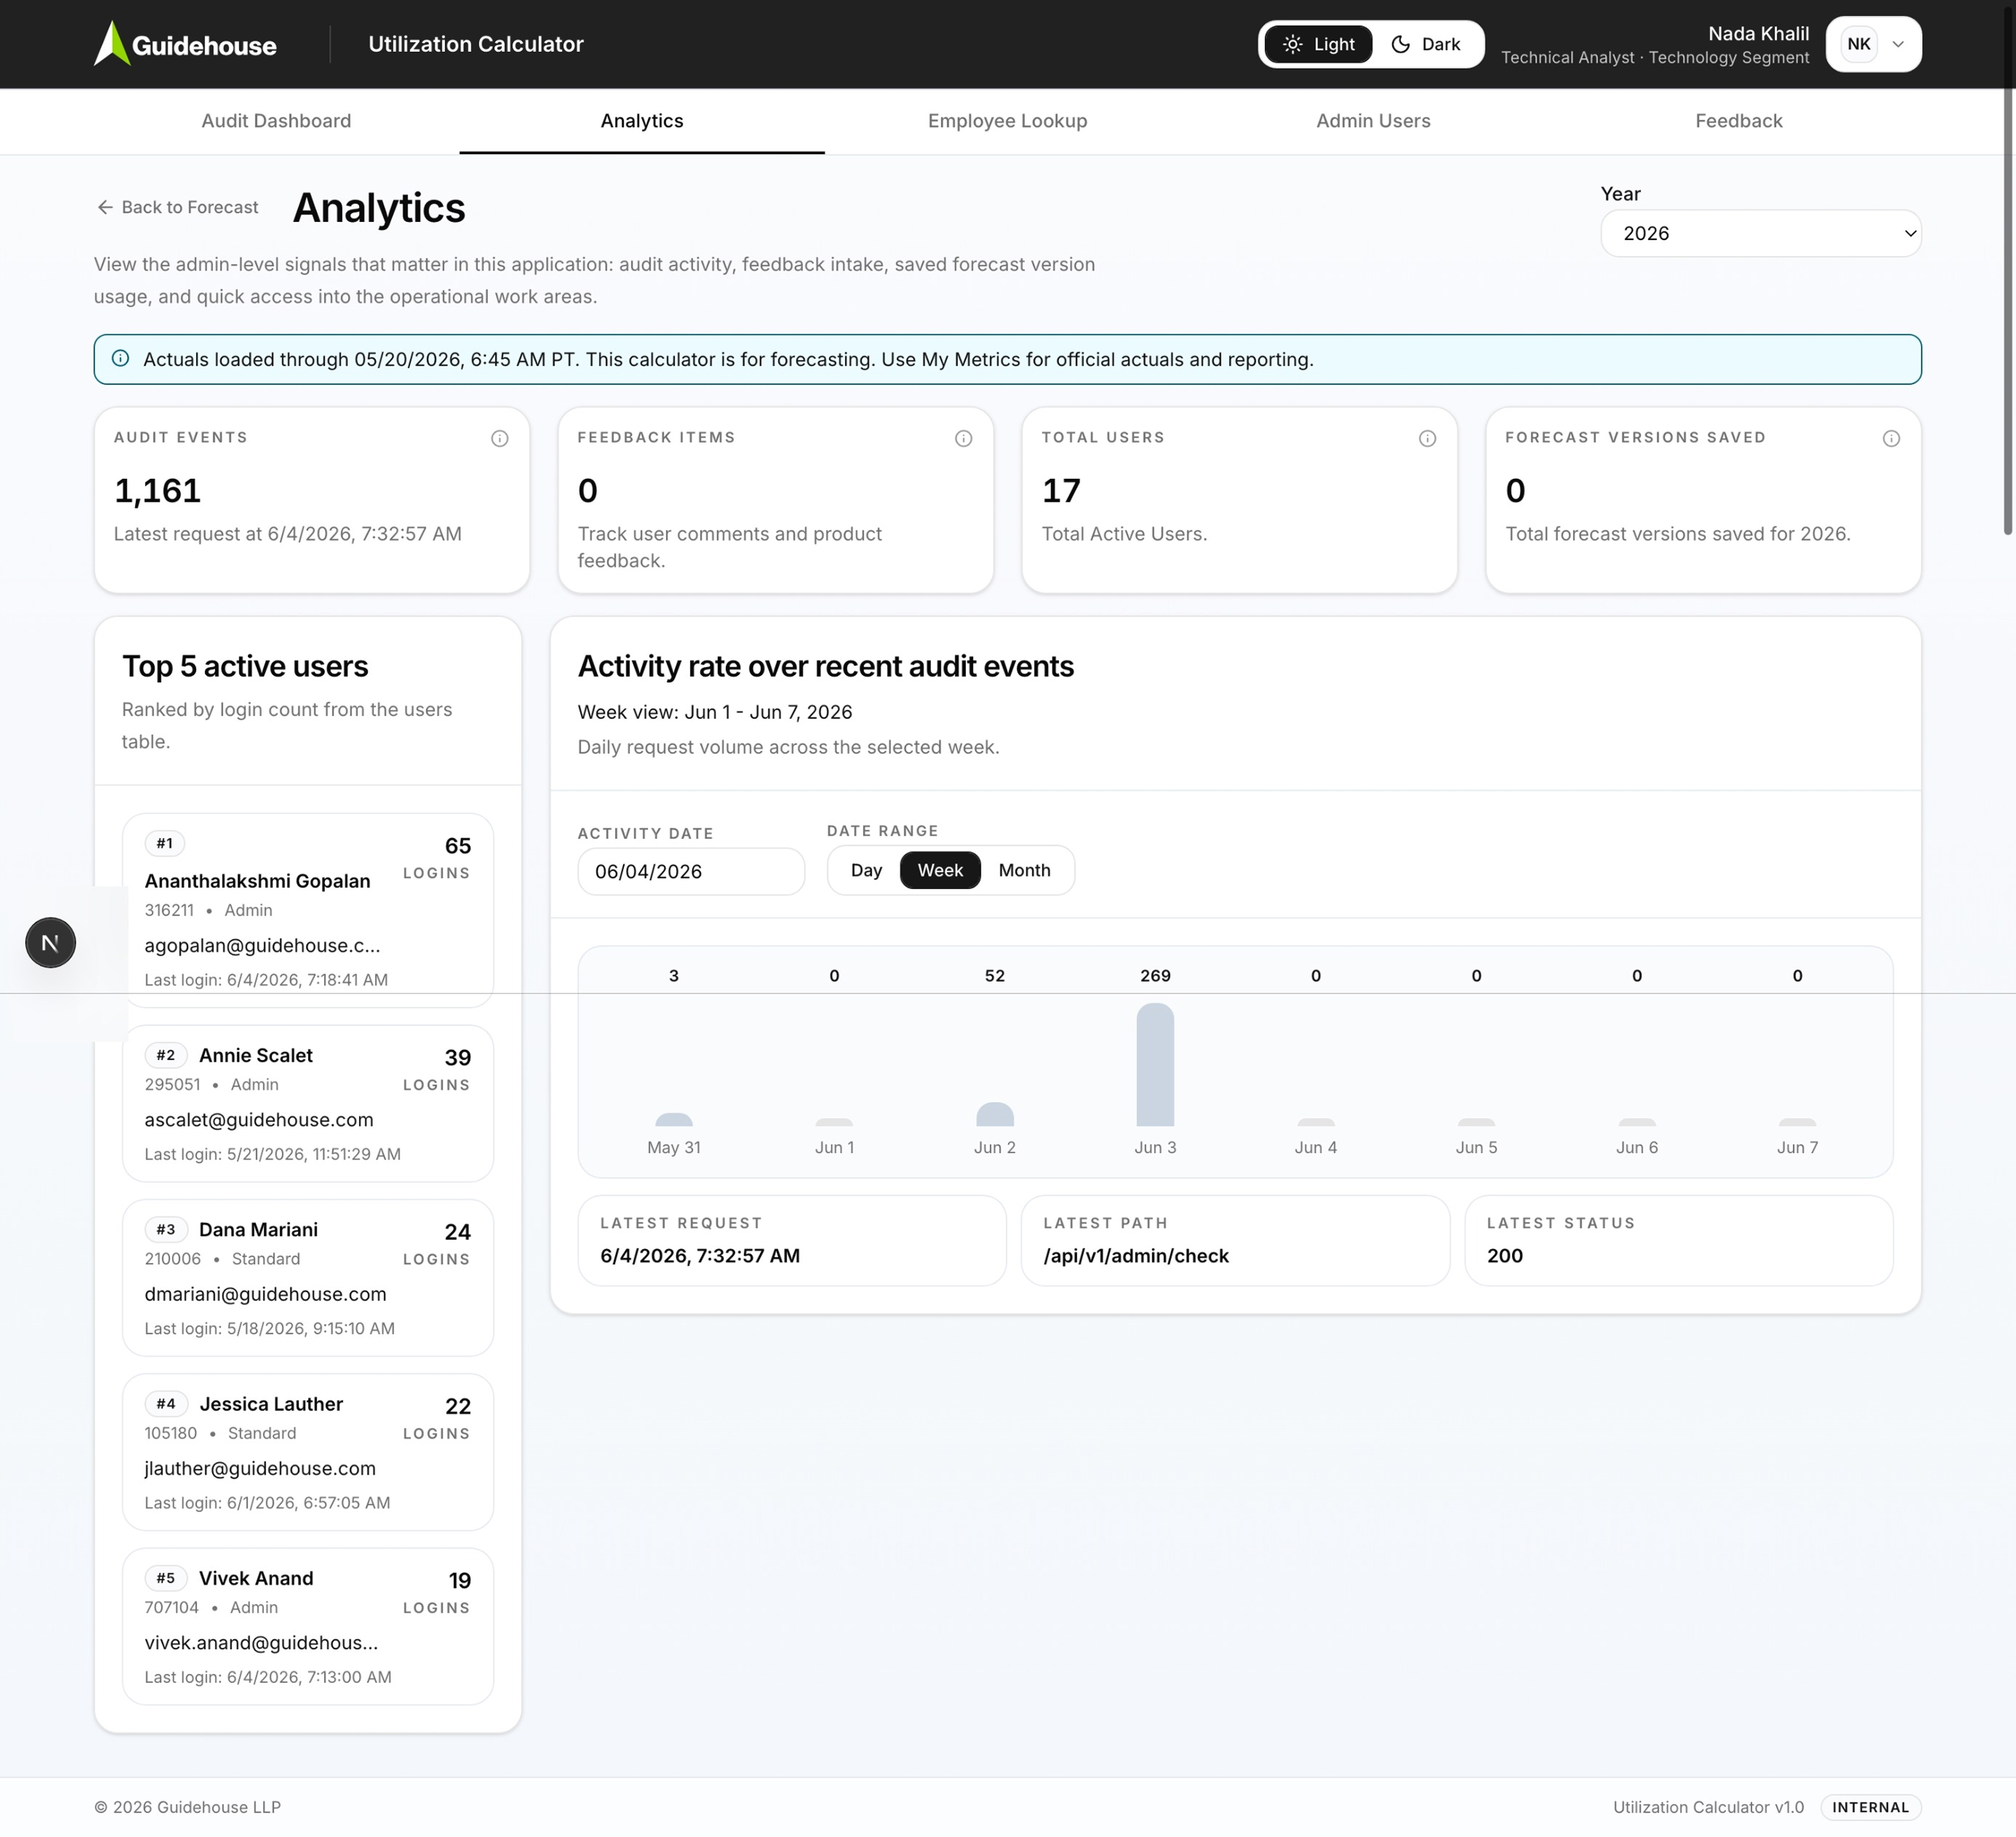
Enterprise tools don't end at launch. They have to be supported, audited, and improved in the open. The admin experience uses one shared table pattern across five surfaces so support teams learn it once.
- Audit Dashboard: API requests, response codes, duration, and user, filterable by date, method, path, status, and user
- Analytics: audit volume, feedback intake, saved forecast version usage, most active users
- Employee Lookup: one combined search field for name, ID, or email
- Admin Users: access management and promotion from a dedicated picker
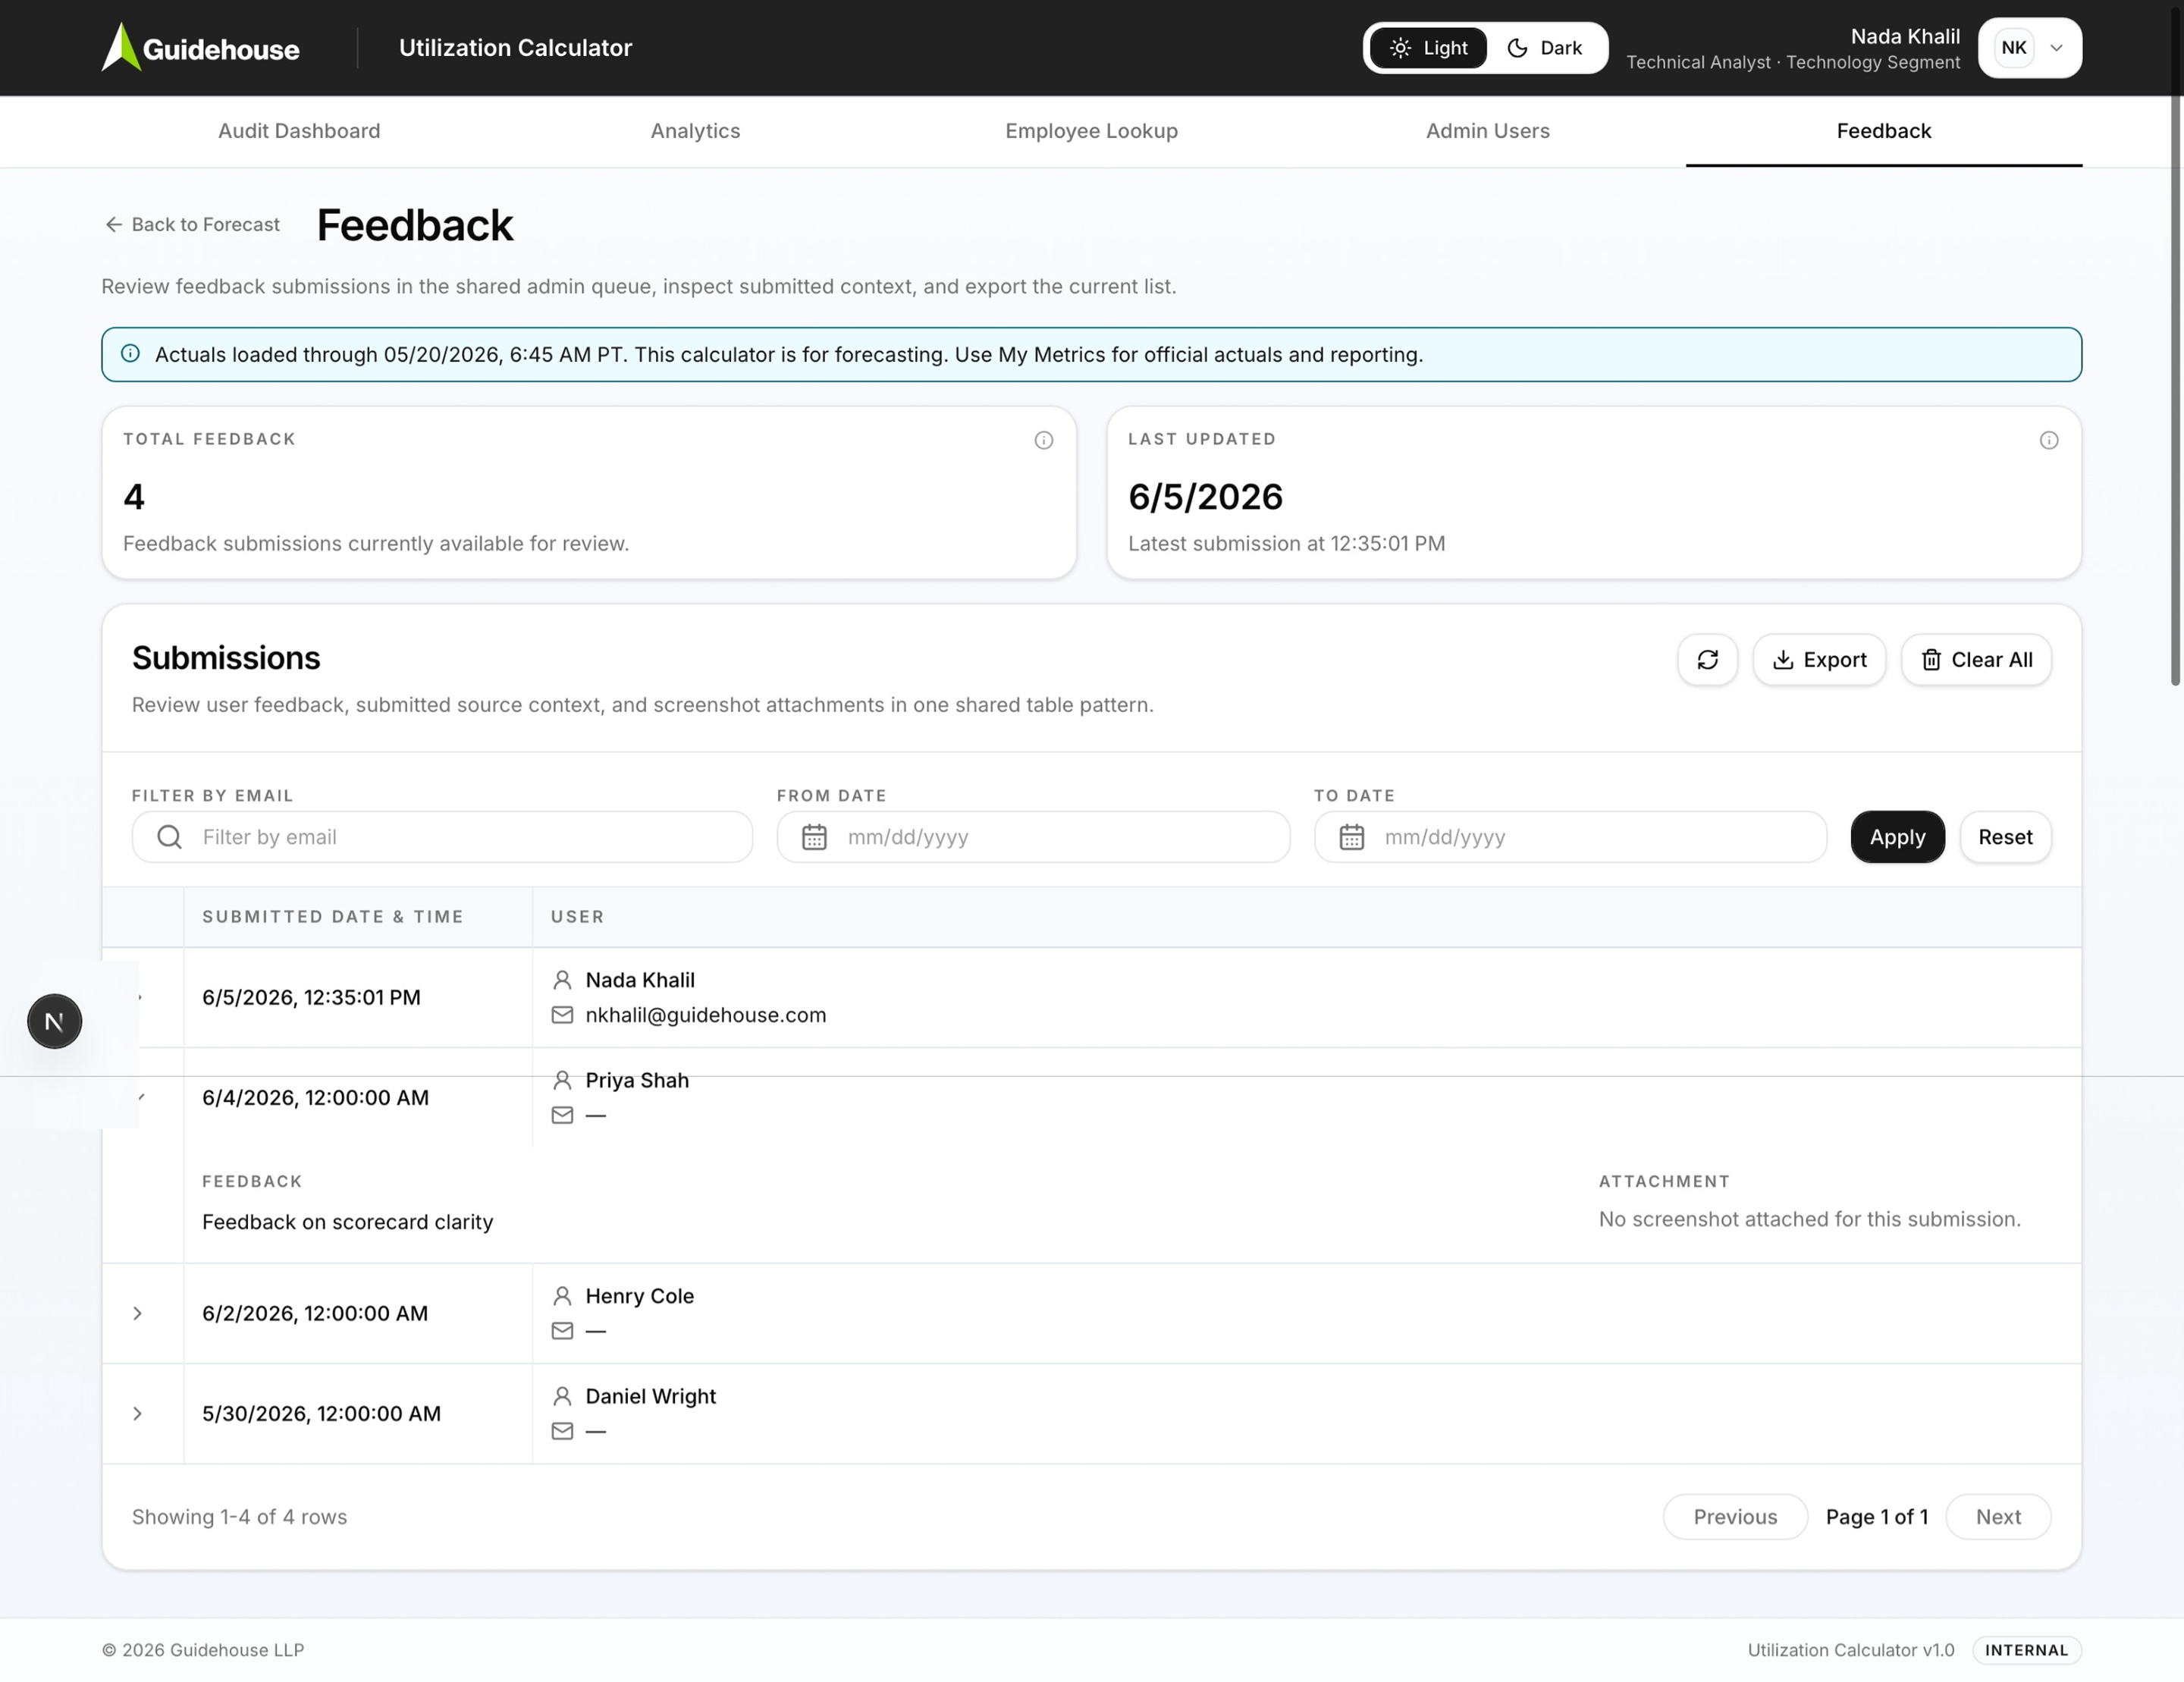
- Feedback: the in-product feedback queue, with submitted source context and screenshot attachments
Feedback as a first-class input
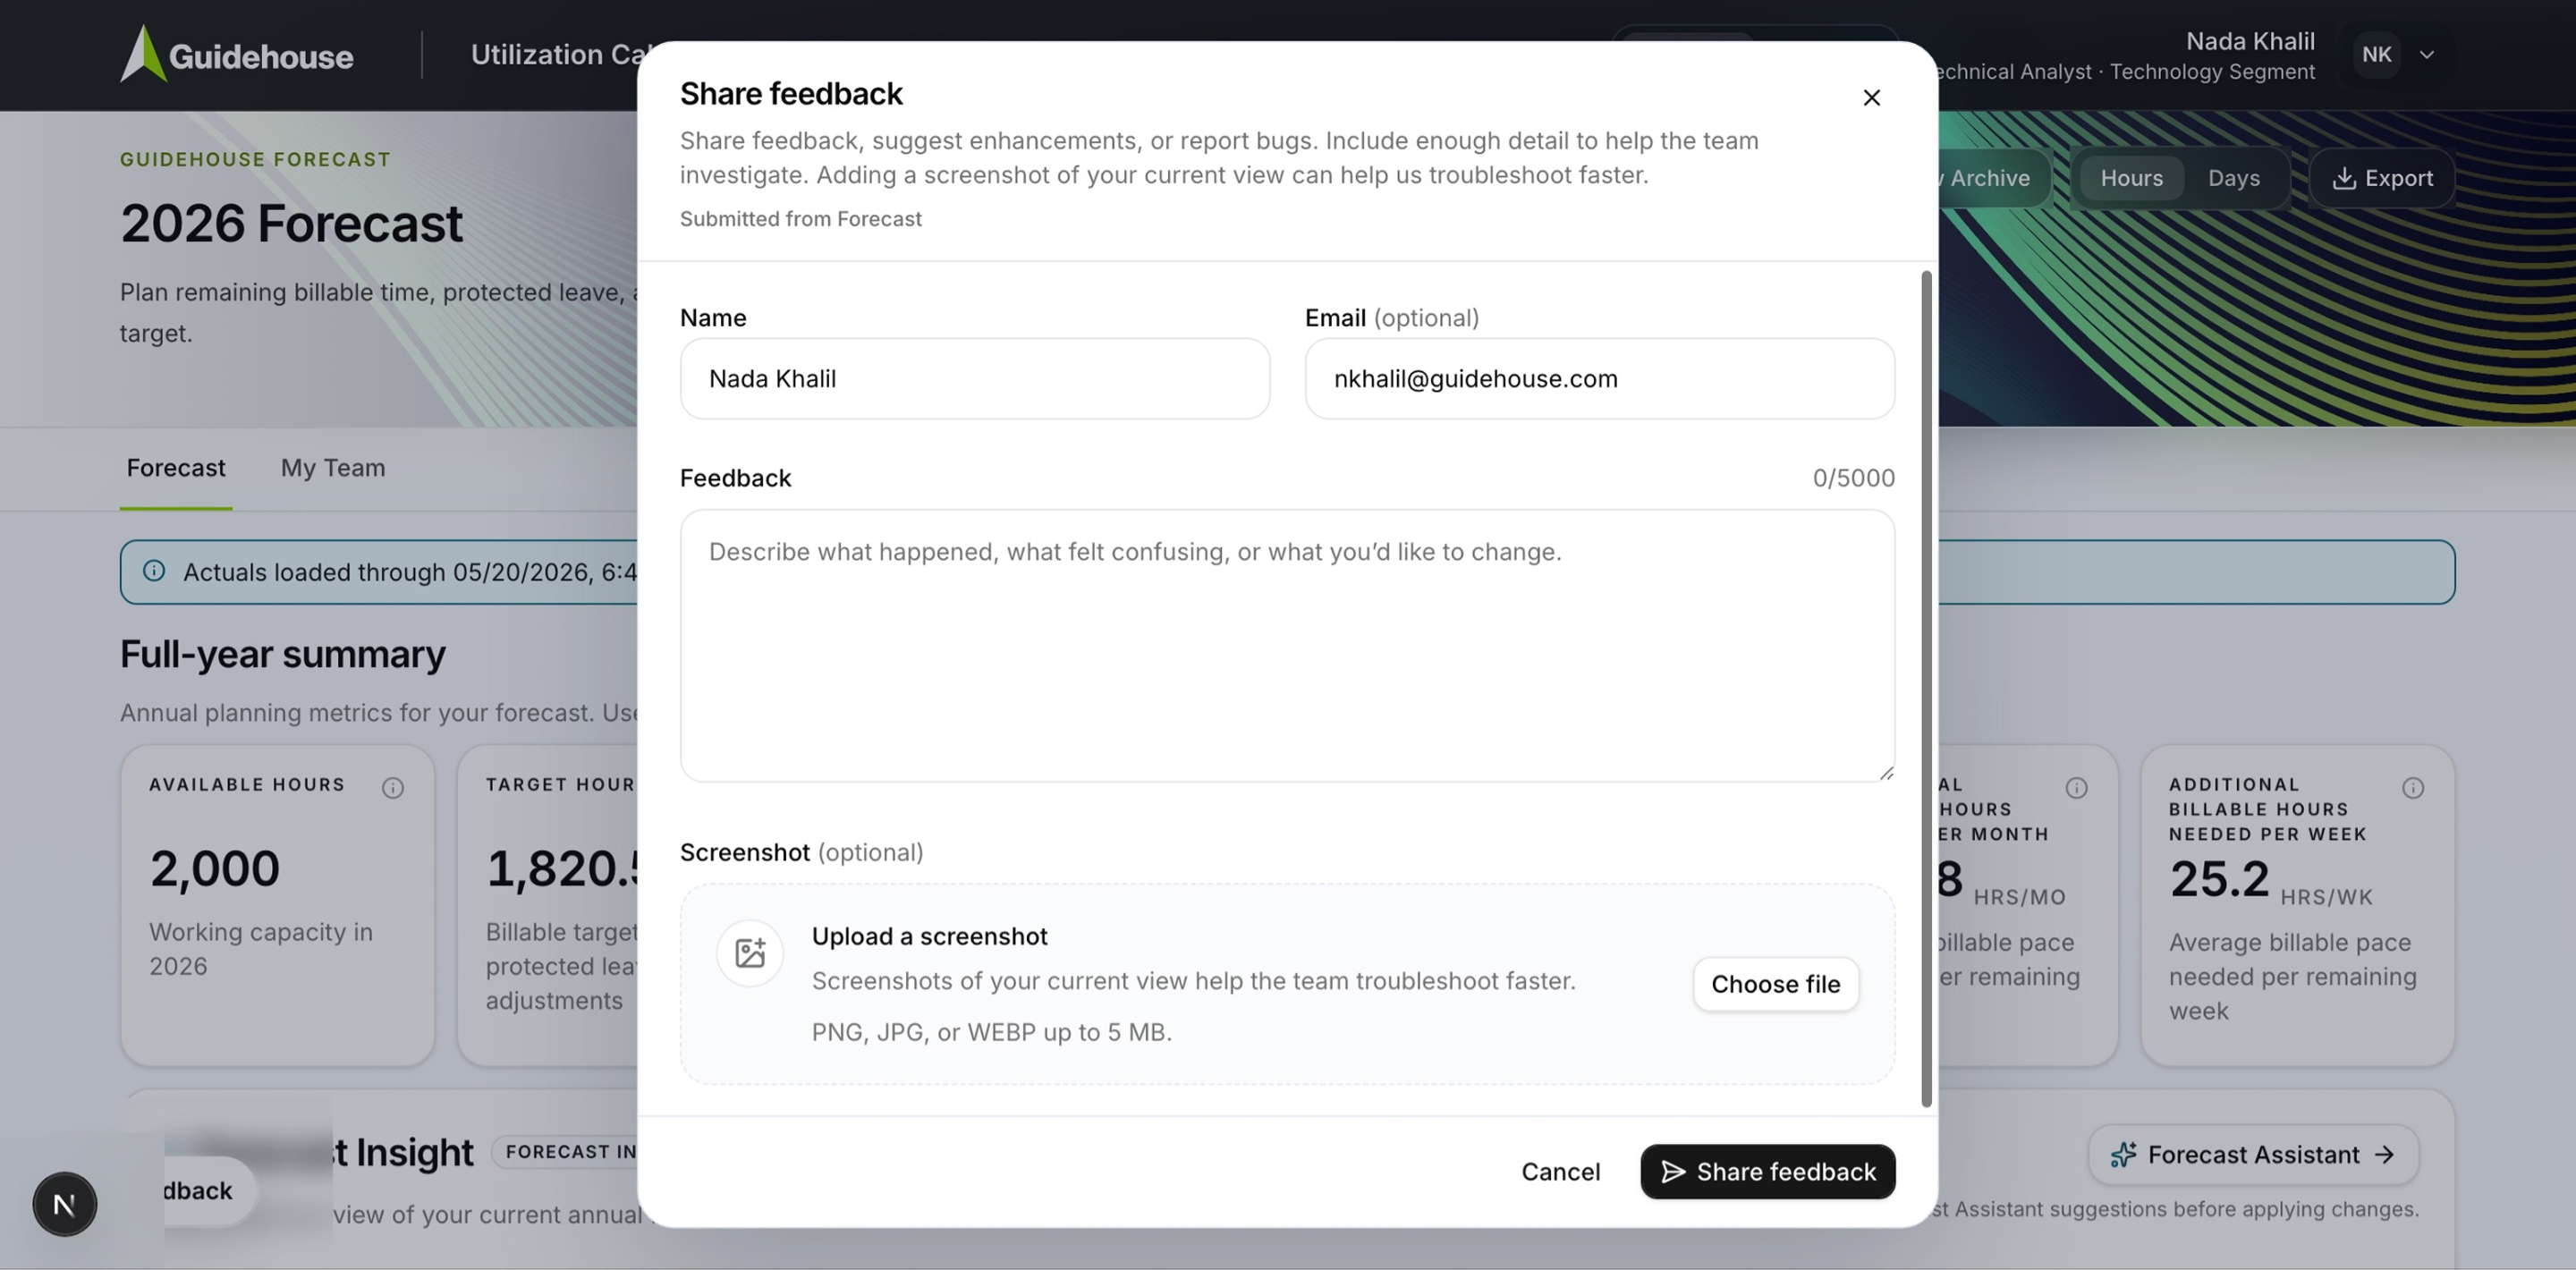
The in-product feedback modal captures the user's name, their message, and an optional screenshot, and stamps which view it was submitted from. It routes into the admin queue, and from there into Jira. The research loop is built into the software.
Fromaspreadsheettoaplanningplatform
- Replaced the legacy Excel utilization calculator with an interactive web application
- Connected live enterprise data (Workday, the Enterprise Data Warehouse, Power BI) to eliminate manual entry
- Enabled scenario-based forecasting throughout the year, not once at planning time
- Improved consistency between employees and People Managers during utilization conversations
- Introduced AI-assisted planning with human review as a required step
- Established a scalable platform for future manager tools, admin features, and international expansion
- Supported launch with documentation, training, FAQs, communications, office hours, and in-product guidance
Scale
Client-service employees with utilization targets across the United States and Canada, followed by People Manager capabilities and planned global expansion.
Reflection
Trust was the feature
This was never really a UI project. It was a financially complex planning process that had to be simplified without being dumbed down, aligned across stakeholders who wanted different things, and given AI that helped with real work instead of performing intelligence.
The hardest constraint turned out to be the most useful one: nothing is visible until you choose to share it. Once that was true, and visibly true on every screen, at every step, people started planning honestly. Everything else the product does depends on that.