Pharma Forecasting Platform
Redesigned an AI-powered forecasting platform for major pharmaceutical clients — translating complex demand analytics into a cohesive, visual-first dashboard for analysts and portfolio managers.
Guidehouse: AI Studio – Health (Commercial) · 2024
Concept demo from the Helios forecasting PoC
Overview
The Pharma Forecasting Platform was developed under AI Studio's Health vertical to help major pharmaceutical clients optimize forecasting and market performance. It enables analysts and portfolio managers to visualize real-time demand trends, predict market shifts, and model future scenarios through an intuitive AI-powered interface.
As Lead UI/UX Designer, I led the experience design, visual system, and data visualization patterns, translating complex analytics into a cohesive and scalable platform for pharma decision-makers.
Objective
- Simplify forecasting workflows for pharma analysts and executives
- Design modular dashboards that support multiple forecasting models
- Improve clarity and usability for complex data visualizations
- Establish a reusable interface standard for future AI Studio health products
Approach
I started by mapping pharma forecasting workflows with the product team to understand how users transitioned between data inputs, predictions, and performance reviews.
Using this insight, I redesigned the experience into three primary views: Market Trends, Portfolio Forecast, and Scenario Modeling, balancing analytical depth with visual simplicity.
Wireframes evolved through iterative stakeholder reviews before moving to a high-fidelity prototype aligned with AI Studio's brand system.
DesignImprovements
Streamlined Navigation
Simplified multi-tab navigation into a unified workspace where users could switch between forecasts and models without losing context.
Visual Hierarchy
Introduced color-coded sections and typography scales for clear distinction between key metrics, trend charts, and filters.
Data Visualization Framework
Defined consistent rules for line charts, heat maps, and comparative bars to standardize insights across therapeutic areas.
Interactive Forecast Cards
Created modular forecast cards that summarize KPIs and allow quick scenario toggling.
Responsive Layout
Designed adaptable grid components for desktop and tablet viewing across pharma client environments.
BeforeandAfter
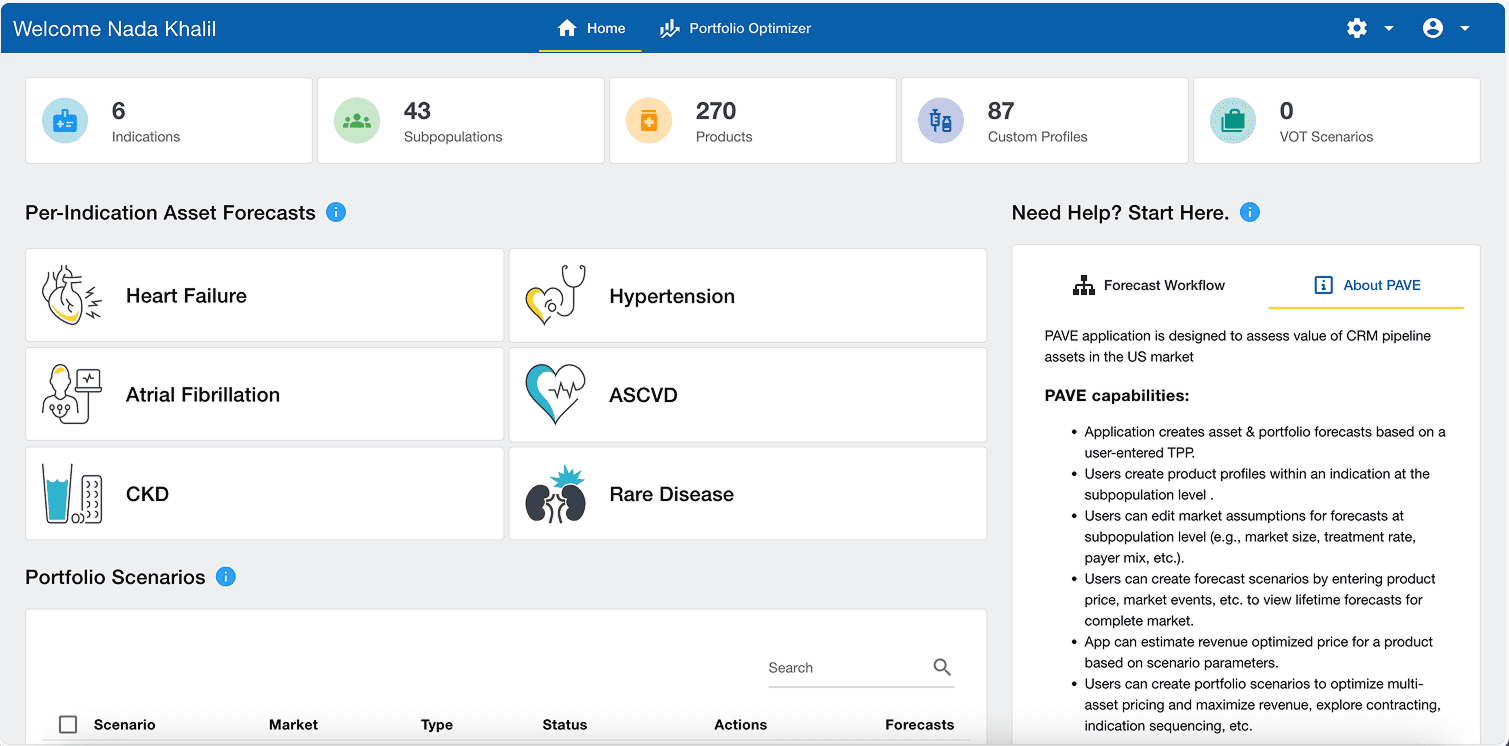
Before: legacy PAVE platform with dense spreadsheet-style layout and cluttered navigation
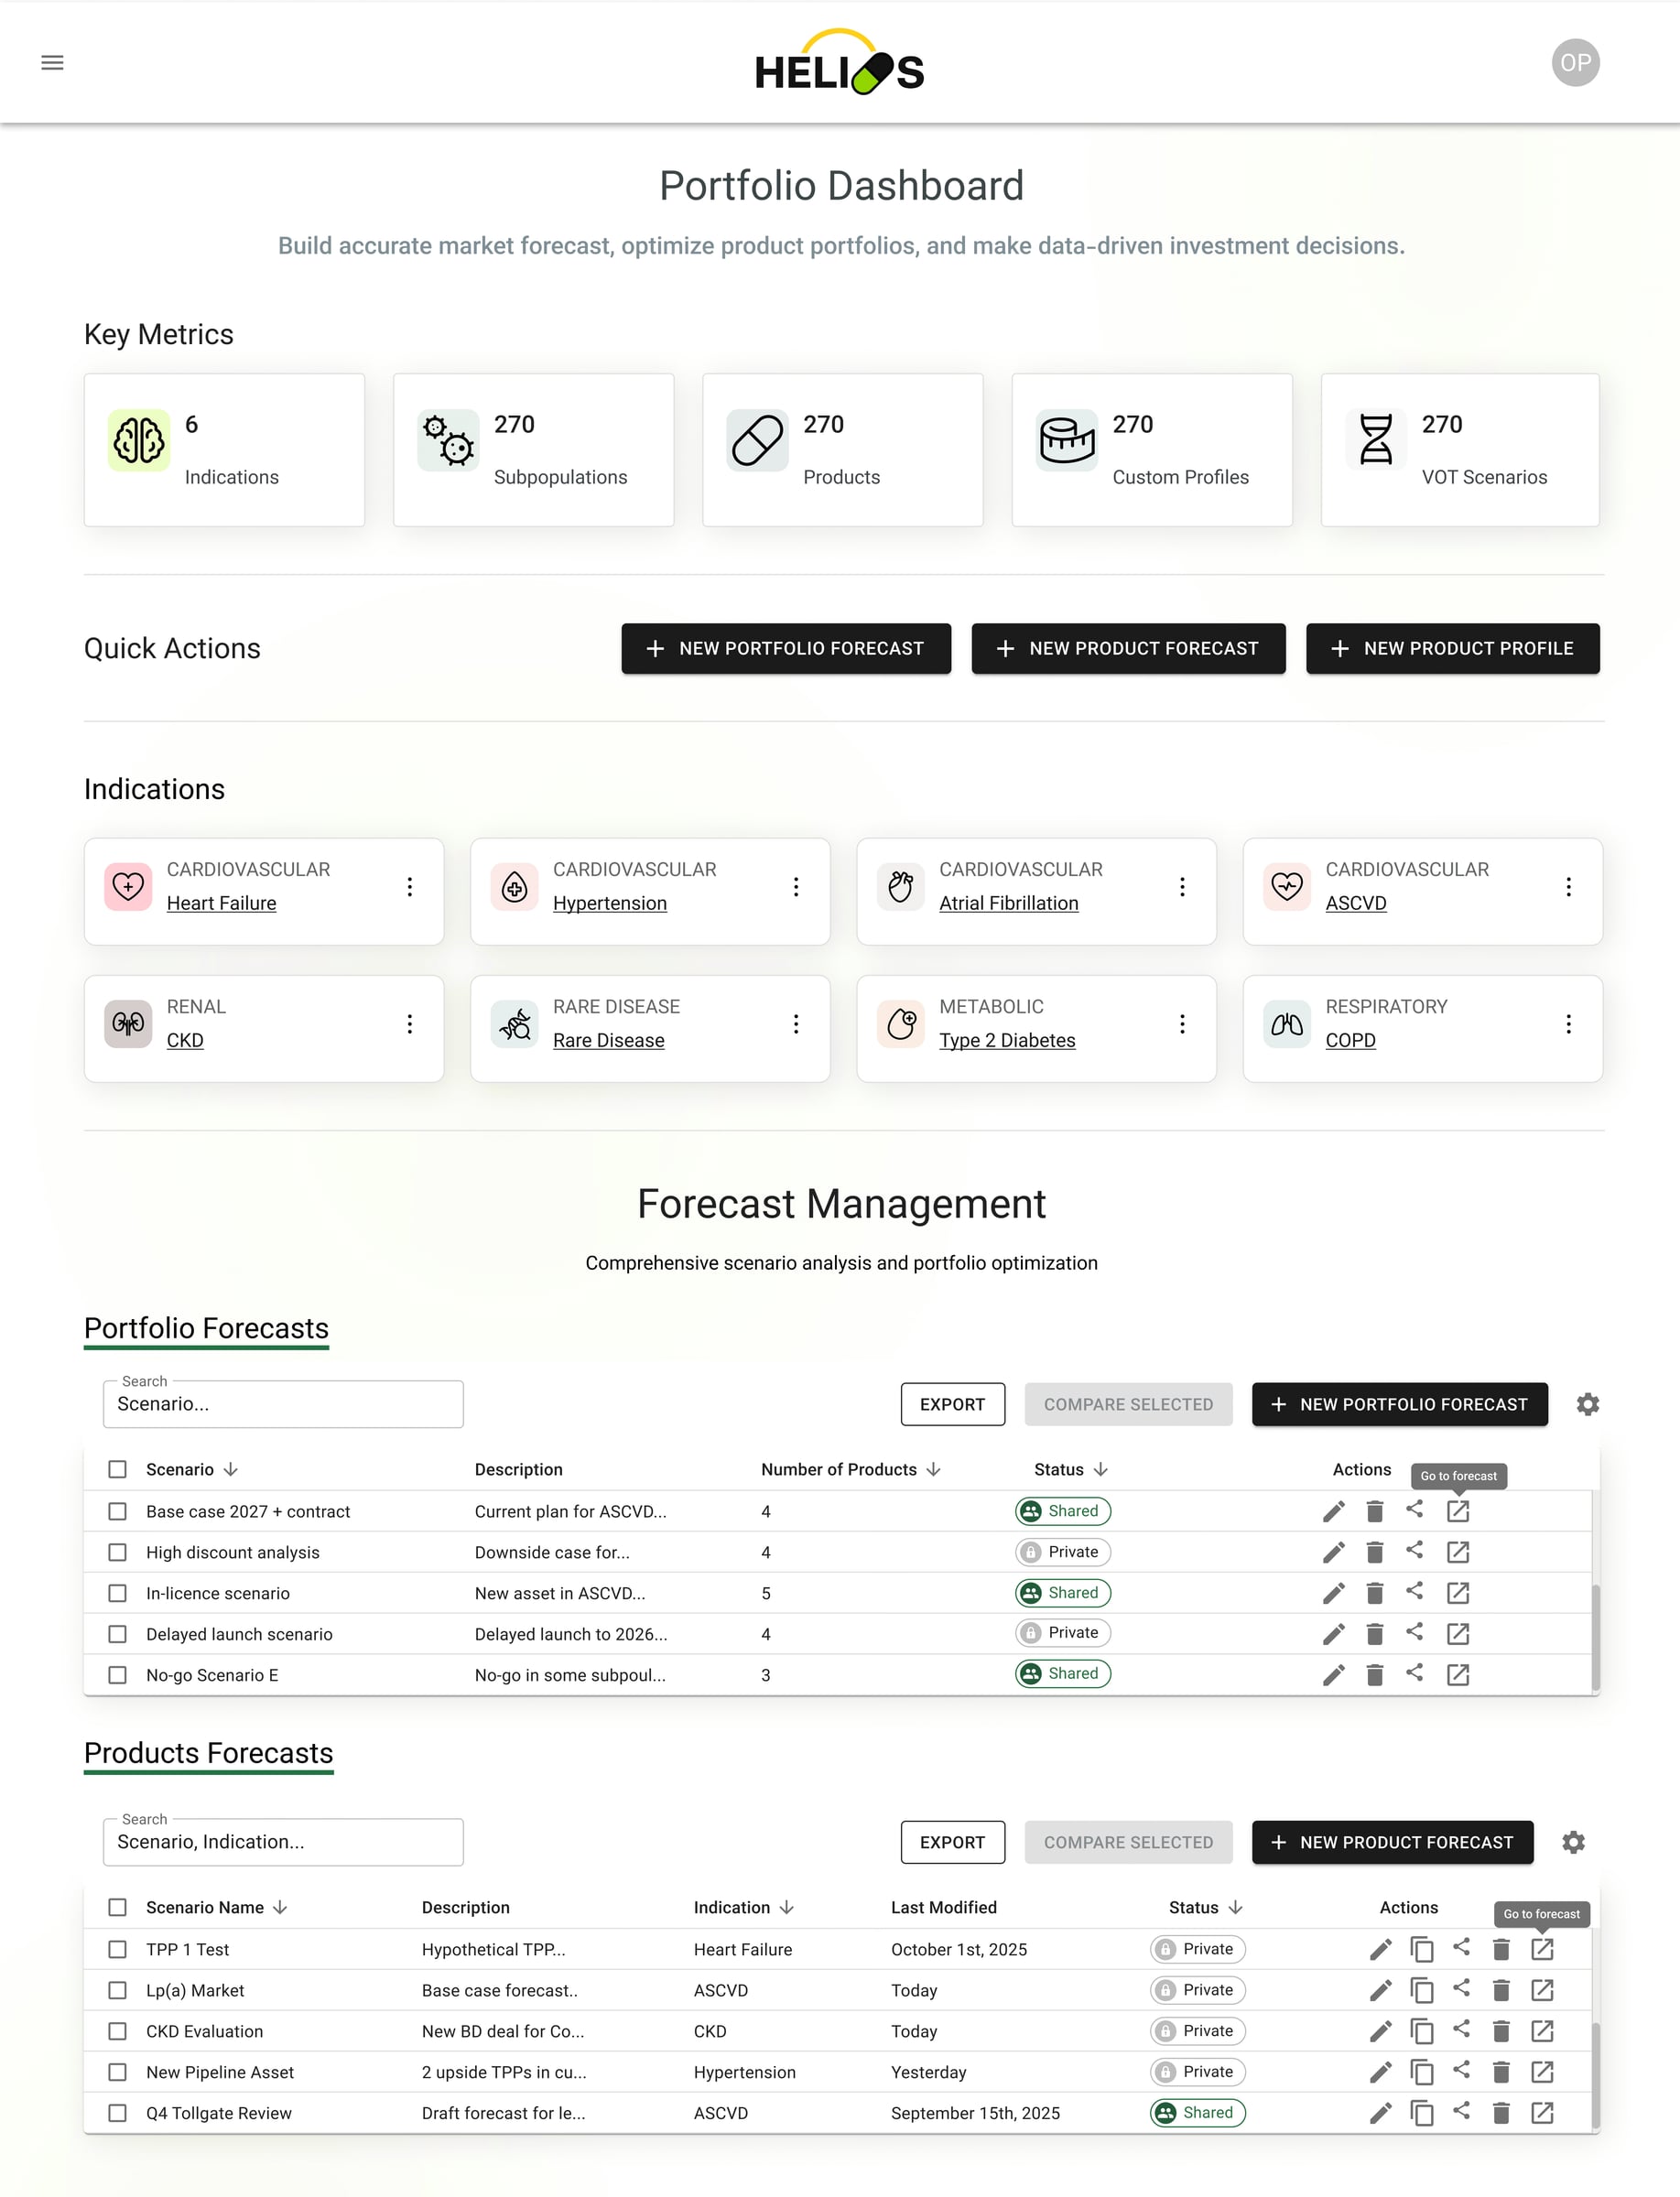
After: unified dashboard with modular cards, clean data visualizations, and simplified navigation
Outcome
- Delivered a cohesive, visual-first dashboard replacing the dense spreadsheet-style layout
- Reduced visual noise and accelerated forecasting workflows for pharma decision-makers
- Established AI Studio's Health vertical design language
- Enabled consistent expansion into other pharmaceutical and healthcare analytics tools
- Set the interface standard for future AI Studio health products